

🍰 Who Ate the Cake? (The Attribution Crisis)
Marketing attribution is like asking: "Who is responsible for the delicious cake?"
Was it the person who bought the flour (First Touch)?
Was it the person who mixed the batter (Middle Touches)?
Or was it the person who put the cherry on top (Last Touch)?
If you ask Sales, they say: "I put the cherry on top. I closed the deal. I built the cake."
If you ask Brand Marketing, they say: "I bought the flour. Without me, there is no cake."
As a SaaS CMO, your job is to divide the credit fairly so you know where to invest your next $100,000.
But if you look at your HubSpot Attribution Reports, you are likely using the Default Model. And the default is often lying to you.
The two most common models are Linear and U-Shaped. One is a "Participation Trophy." The other is the "SaaS Standard."
Here is the diagnostic to determine which one is driving your strategy (and if it’s the wrong one).
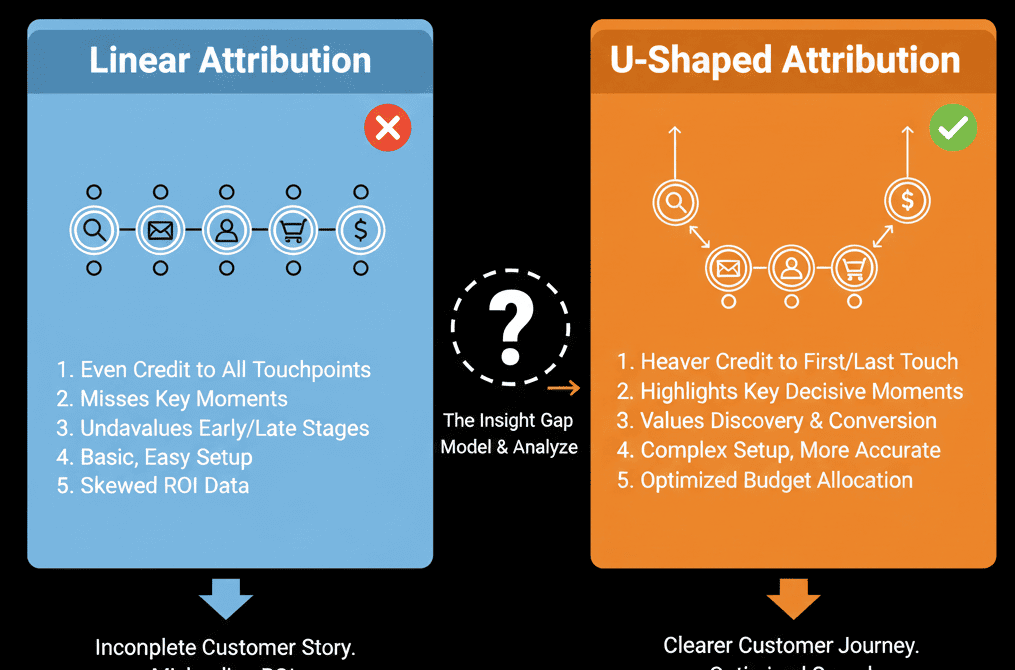
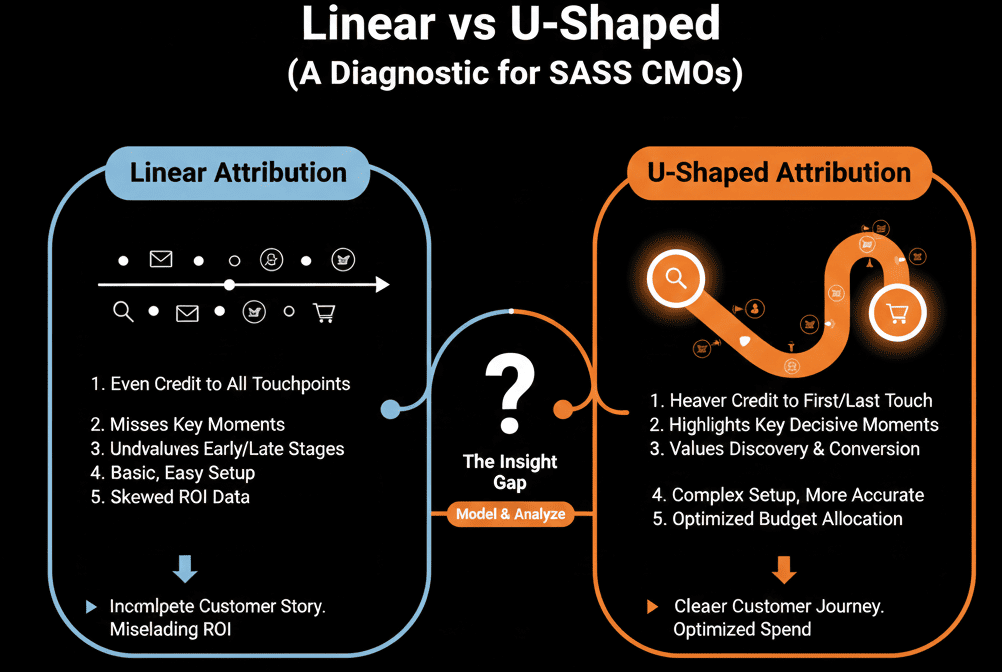
🩺 Diagnostic 1: The "Linear" Trap (The Participation Trophy)
The Model: Linear Attribution gives equal credit to every single interaction in the journey.
- A user reads a blog post (10%).
- They click an ad (10%).
- They open 5 sales emails (50%).
- They sign the contract (10%).
The Diagnosis: If you use Linear, your data looks "flat."
The Lie: It overvalues low-impact touches (like random page views) and undervalues high-impact moments (like the Demo Request).
The Risk: You might cut budget from your high-performing Ads because "Sales Emails" are eating up 50% of the credit in the report.
Verdict: Linear is useful for long journeys to see "influence," but it is terrible for budget allocation. It’s a participation trophy where everyone wins, so no one wins.
🩺 Diagnostic 2: The "U-Shaped" Standard (The Anchor)
The Model: U-Shaped emphasizes the two most important moments:
- First Touch (40%): How did they find us? (e.g., Google Search).
- Lead Creation (40%): How did they convert? (e.g., Webinar Form)]
- Middle Touches (20%): Everything else splits the remaining 20%.
The Diagnosis: This is the Gold Standard for B2B SaaS.
The Truth: In SaaS, the hardest part is getting them to the site and getting them to sign up. Once they are a lead, it’s Sales’ job.
The Benefit: It gives massive credit to Content (First Touch) and CRO (Lead Creation). It aligns perfectly with a Marketing Leader's goals.
Verdict: If you are a specialized Marketing team, switch your reports to U-Shaped immediately.
🩺 Diagnostic 3: The "W-Shaped" Advanced (The Pipeline View)
The Model: W-Shaped adds a third pillar.
- First Touch (30%).
- Lead Creation (30%).
- Deal Creation (30%): When did they become an Opportunity?
- Remaining (10%).
The Diagnosis: This brings Sales Alignment into the picture.
The Truth: It acknowledges that generating a lead isn't enough; generating an Opportunity is the goal.
Verdict: Use this if your Marketing team has a "Pipeline Commit" goal, not just an "MQL" goal.
🛠️ How to Change Your View in HubSpot
You don't have to pick just one. HubSpot allows you to toggle between them to see the difference.
- Go to Reports > Reports.
- Create a Revenue Attribution report.
- Scroll down to "Attribution Model."
The Test: Select both "Linear" and "U-Shaped."
The Insight: Look at "Paid Search."
In Linear, it might show $10k influenced revenue.
In U-Shaped, it might show $50k revenue.
Why? Because Paid Search usually drives the First Touch. U-Shaped respects that; Linear dilutes it.
Don't Let the Default Dictate Your Budget.
If you are making budget decisions based on "Last Touch" (Sales bias) or "Linear" (Noise), you are misallocating capital.
Data is only as good as the lens you view it through.
For most SaaS companies, U-Shaped is the lens that reveals the true ROI of marketing.
Not sure which model fits your sales cycle length?
Get Credit for Your Work. Get Your Free Health Check.
This is part of our Free HubSpot Health Check. We will audit your "Attribution Settings." We'll compare your models, check your interaction sources, and help you build the "CMO Dashboard" that proves exactly which channels are driving revenue.
Get Credit for Your Work. Get Free Hubspot Audit.