

📊 The "Screenshot" Presentation
It’s the 1st of the month. You have a Board Meeting on the 5th.
You spend the next 3 days:
- Running reports in HubSpot.
- Exporting to Excel.
- Making charts.
- Copy/pasting screenshots into PowerPoint.
By the time you present, the data is 5 days old. And if a board member asks, "What deals make up that number?" you can't click on the screenshot to show them. You look unprepared.
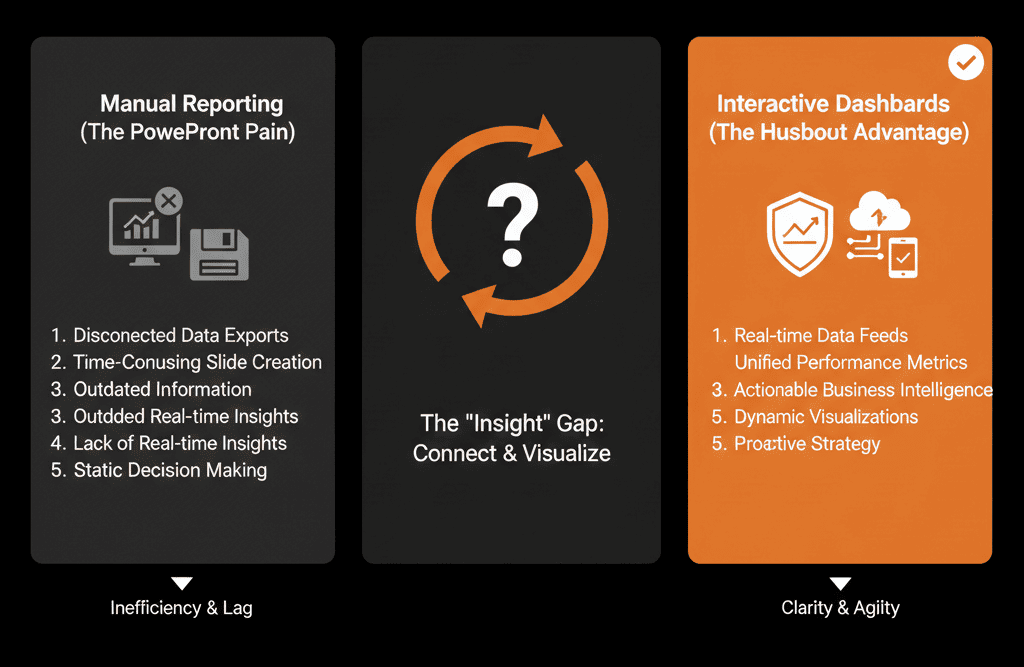
This is the "Static Reporting" trap.
You need a "Prescriptive Dashboard."
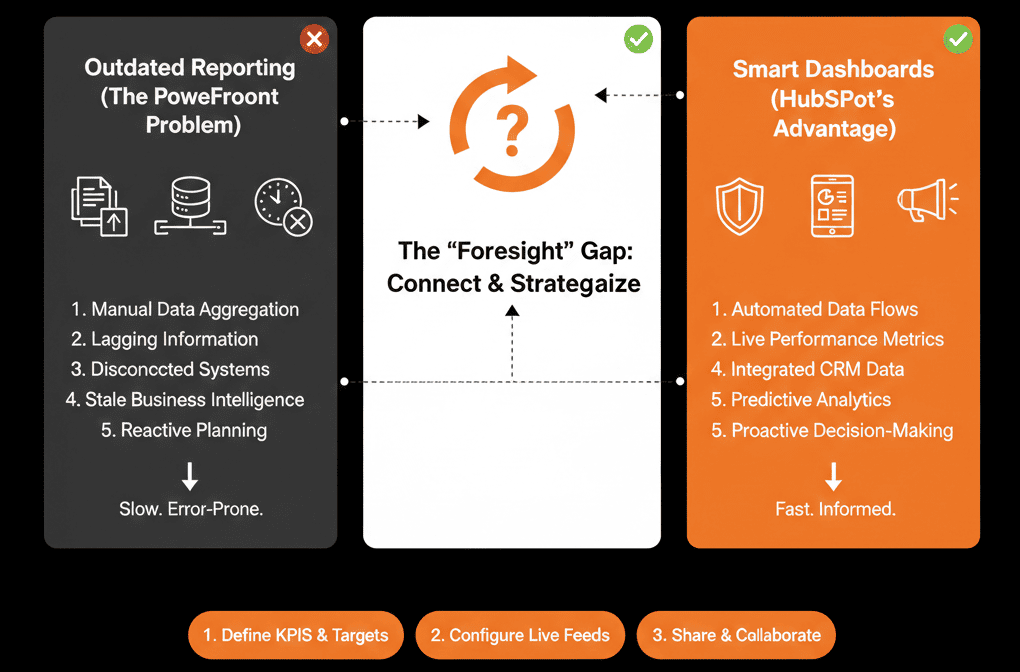
This isn't just a collection of random charts. It is a narrative. It is built to answer the Board's questions in order, live, with drill-down capability.
Here is how to structure the dashboard that kills the slide deck.
🏛️ The Structure: The "3-Question" Dashboard
Don't just dump data. Tell a story. Your dashboard should answer 3 questions, in vertical order.
Section 1: "How did we do?" (The Rearview Mirror)
Target: The Past Quarter.
- Report 1: Closed Revenue vs. Goal. (The Headline).
- Report 2: Revenue by Source (Inbound vs. Outbound).
- Report 3: CAC (Customer Acquisition Cost).
The Narrative: "We hit 110% of goal, driven primarily by Outbound efficiency."
Section 2: "Where are we going?" (The Windshield)
Target: The Current/Next Quarter.
- Report 4: Weighted Pipeline Forecast. (The Prediction).
- Report 5: Pipeline Velocity (Days to Close).
- Report 6: Deal Stage Movement (Velocity).
The Narrative: "We have 3x coverage for next quarter, but deals are slowing in the 'Contract' stage."
Section 3: "What are we doing about it?" (The Action)
Target: Activity & Inputs.
- Report 7: Meetings Booked (Leading Indicator).
- Report 8: New Opportunities Created.
- Report 9: Sales Activity by Rep.
The Narrative: "To fix the slowdown, we have increased top-of-funnel activity by 20%."
🛠️ The Technical Setup (Ops Hub Enterprise)
To make this "Board Ready," you need polish.
1) Use Text Blocks (Narrative)
HubSpot dashboards let you insert text (and other media) onto the dashboard so you can write the story between charts instead of using a PowerPoint slide.
2) Use Data Sets (Ops Hub Enterprise)
For consistent reporting, Ops Hub Enterprise includes datasets so Ops can curate clean, reusable tables for business users (and avoid confusing “raw” property names).
3) Use Embeds
You can embed external content on a HubSpot dashboard (URL or embed code) so a Google Sheet, Google Slides, or Loom video can live alongside your reports.
Click Through the Question.
The power of a live dashboard is the Drill-Down.
Board Member: "That 'Enterprise' number looks low. Why?"
You: Click the bar chart.
HubSpot: Shows the list of 5 deals that slipped.
You: "Ah, the Acme deal pushed to October. Here is the note from the rep."
You just answered a question with live data in 3 seconds. You look like a genius.
Not sure how to calculate CAC inside HubSpot?
Kill the PowerPoint. Get Your Free Health Check.
This is part of our Free HubSpot Health Check. We will audit your "Reporting Stack." We'll build the calculated fields, design the "3-Question" layout, and help you present your next board meeting directly from the CRM.
Kill the PowerPoint. Get Free Hubspot Audit.