
📉 The "I Think It's Working" Meeting
It’s time for the Quarterly Business Review (QBR) with your biggest client.
You spend 4 hours exporting data, making charts in Excel, and pasting them into PowerPoint.
You get on the call. You show the slide.
The client asks: "Is this data from last month? It looks different than my internal numbers."
You stumble. The trust erodes. The renewal is at risk.
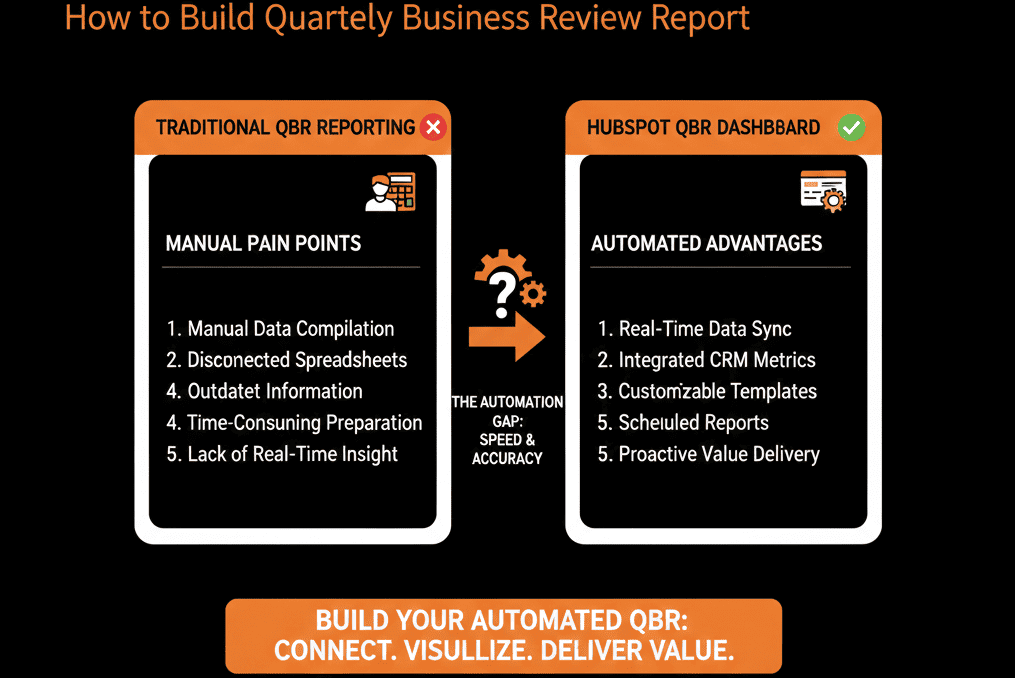
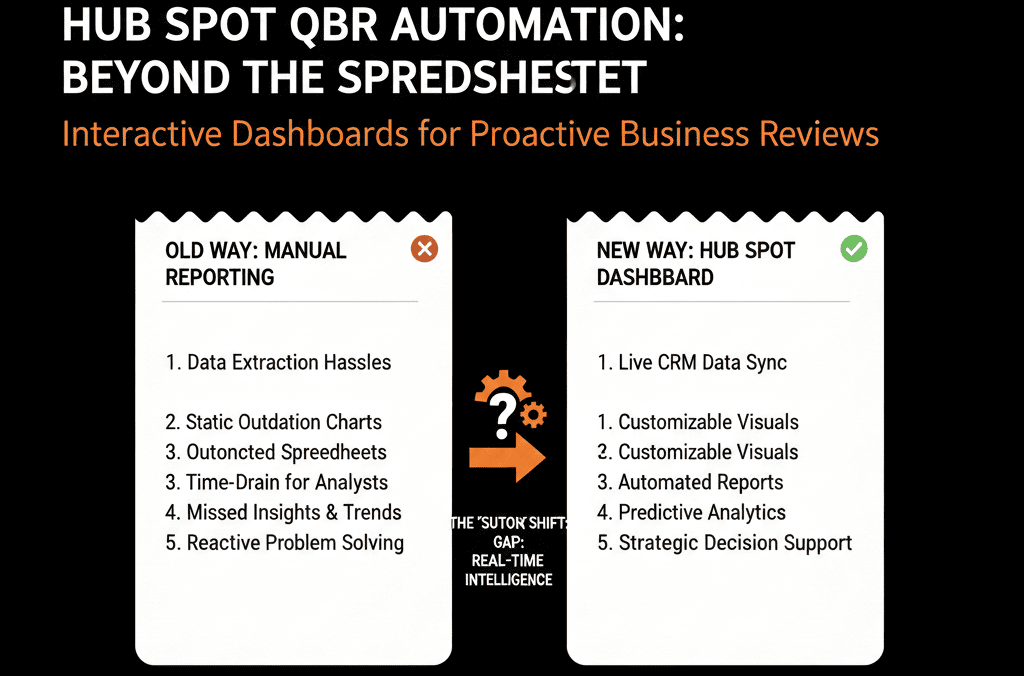
This is the "Static Reporting" failure.
In 2026, clients expect Real-Time Transparency. They don't want a slide deck telling them "It's working." They want a dashboard proving it.
You can build this inside HubSpot. By creating a specific "Client-Facing Dashboard," you can automate the QBR prep and focus on strategy instead of data entry.
Here is the blueprint.
🏛️ The 3 Pillars of a QBR Dashboard
Don't just show "Activity" (We did X). Show "Value" (You got Y).
Pillar 1: The "Usage" Metrics (Are they using it?)
The Goal: Prove adoption.
The Reports:
- Logins per Month: (Requires App Integration).
- Seats Active: (Are they paying for 50 but using 10?).
- Key Features Used: (Did they activate the "Pro" feature?).
The Insight: "You are utilizing 85% of your license. Great ROI." OR "You are only using 10%. Let's schedule training."
Pillar 2: The "Support" Metrics (Are they happy?)
The Goal: Prove health.
The Reports:
- Tickets Created vs. Closed: (Are we solving their problems?).
- Average Response Time: (Are we fast?).
- NPS / CSAT Score: (How do they feel?).
HubSpot’s service analytics suite includes service reports for customer satisfaction scores and average ticket response time. ]
The Insight: "We resolved 20 tickets this quarter with a 98% satisfaction rate."
Pillar 3: The "Outcome" Metrics (Did they win?)
The Goal: Prove ROI. (The hardest part).
The Reports:
- If you are a Marketing Agency: "Leads Generated," "Revenue Influenced."
- If you are a SaaS: "Time Saved," "Money Processed," "Efficiency Gain."
The Insight: "Our tool processed $1M in transactions for you. Your ROI is 10x."
📤 How to Share It (The "External" Link)
Option 1: The "Recurring Email" (Easy)
- Go to the Dashboard.
- Click "Email this Dashboard."
- Set Recipient: The Client.
- Set Frequency: Quarterly (or Monthly).
HubSpot allows sending dashboards by email and configuring recurring dashboard emails.
Result: It arrives in their inbox automatically.
Option 2: The "External Link" (Enterprise)
Use HubSpot Customer Portal or Content Hub (password protected page).
Embed the reports on a landing page.
HubSpot supports embedding external content on dashboards (and creating client-facing portal-style experiences with gated access).
Give the client a login.
Result: A true "Client Portal" experience.
Don't Be a "Data Janitor."
If your Account Managers are spending Fridays building PowerPoints, they aren't "Managing Accounts." They are "Data Janitors."
Automate the reporting. Spend the QBR discussing Strategy.
"Now that you see the ROI is 10x, let's talk about expanding to your other division."
That is how you win the renewal.
Not sure how to calculate "Time Saved"?
This is part of our Free HubSpot Health Check.
We'll help you define the metrics that matter to your clients and build the dashboard that proves your value every single day.