

Product Analytics Knows What Users Do. HubSpot Knows Who and Why.
Most B2B SaaS stacks look like this:
- Product analytics (Pendo, Amplitude, Mixpanel, custom).
- Warehouse + BI for deep analysis.
- HubSpot for marketing, sales, and CS.
- Billing for MRR/ARR.
Problems when they’re disconnected:
- Sales doesn’t see who’s actually using the product.
- CS can’t easily see usage next to renewals/pipeline.
- Product teams don’t see how usage ties to revenue segments.
The answer is not to stream every click into HubSpot.
It’s to bring in just enough product insight to drive GTM decisions and actions.
Here’s how we architect that.
Step 1 – Clarify Roles: HubSpot vs Product Analytics vs Warehouse
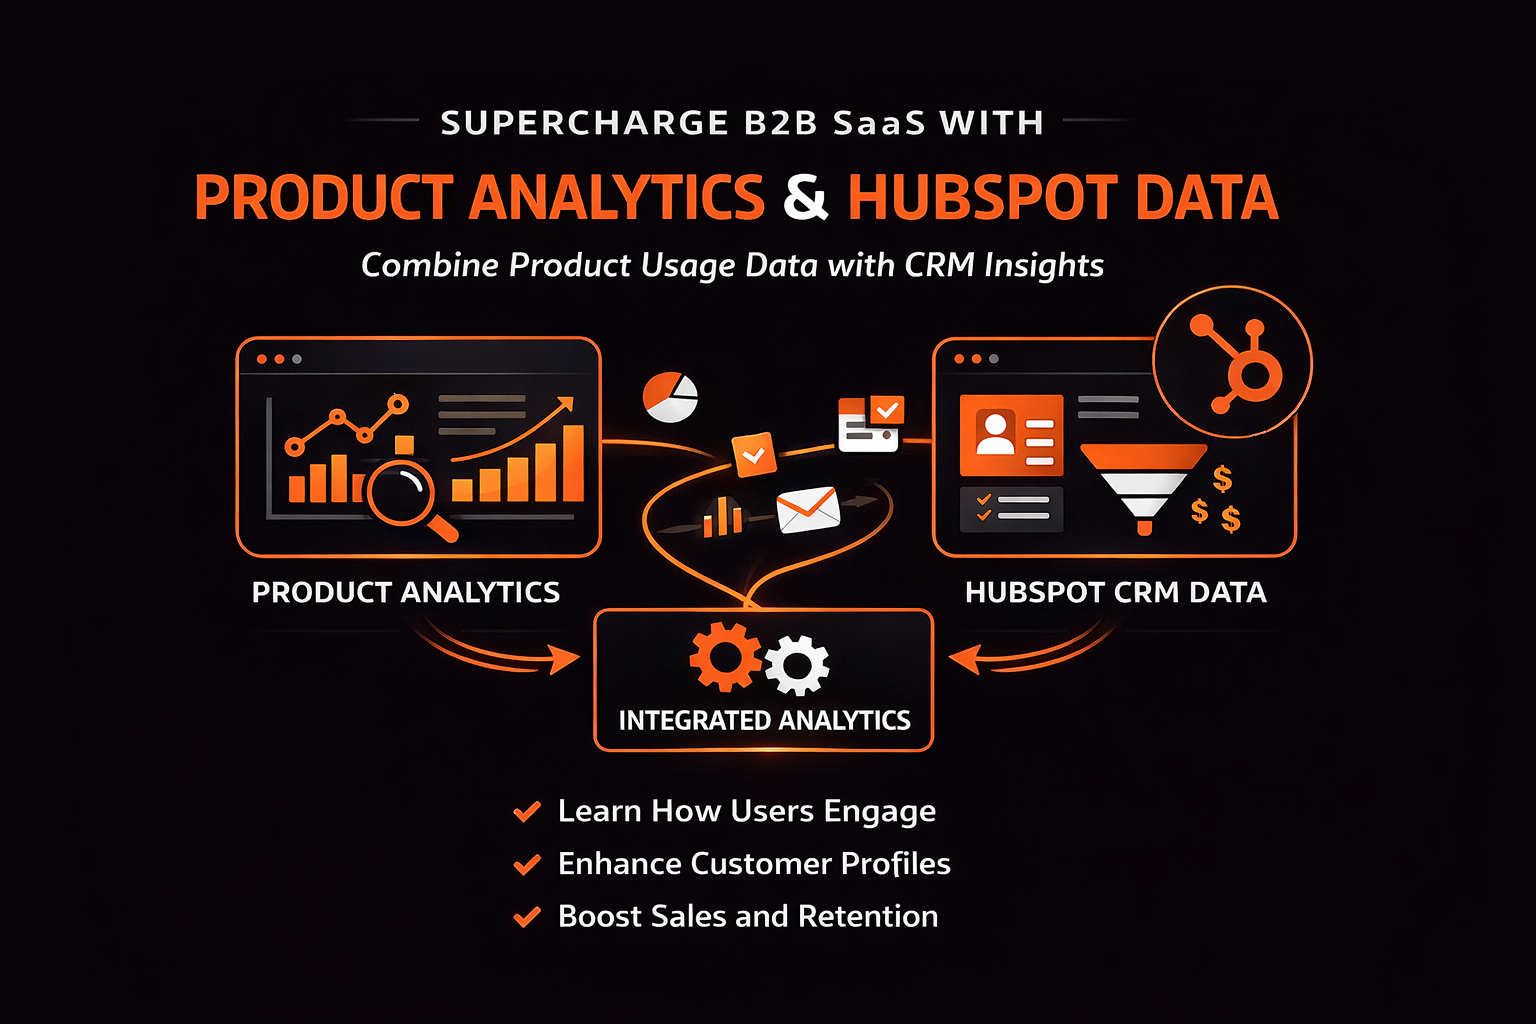
Set lanes:
- Product analytics: full event stream; UX and feature optimization.
- Data warehouse + BI: cohort analysis, retention, advanced reporting.
- HubSpot: GTM & RevOps system of record:
- Accounts, contacts, deals.
- High-level usage and health signals.
- MRR/ARR and lifecycle stages.
This way, HubSpot is the place where humans act, powered by curated data.
Step 2 – Establish a Clean Account & User Model in HubSpot
You can’t combine data if the identity model is messy.
In HubSpot:
Companies = accounts/workspaces.
Keys: domain, product account ID (e.g., workspace_id), billing account ID.
Contacts = users.
Keys: email, product user ID.
On Companies, store:
- Plan / Tier.
- MRR / ARR.
- Customer status (Trial, Active, Churned).
- Segment and Region.
- Primary owner (CSM/AM).
On Contacts, store:
- Role (Admin, Champion, Decision-maker, End user).
- Signup type (Trial, Invite, SSO).
Ensure you can:
- Join product events by workspace_id/user_id to HubSpot Companies/Contacts reliably.
Step 3 – Decide Which Product Signals GTM Actually Needs
Work backwards from GTM questions:
- Who’s ready for sales-assist or expansion?
- Which accounts are at risk before renewal?
- Which features drive conversion and retention?
Typical account-level signals to sync into HubSpot:
- Active users last 7/30 days.
- Core feature adoption flags (Yes/No for key actions).
- Usage level (Low/Med/High).
- Last active date.
- Plan limit pressure (e.g., seats used / seats allowed).
- Integration status (connected to key tools?).
User-level, only when necessary:
- Last login date.
- Is power user / champion (Yes/No).
- Feature-specific usage if it informs outreach (e.g., used feature X but not Y).
Avoid sending raw events.
Step 4 – Create Health and PQL/PQA Properties Based on Usage
Translate raw metrics into interpretable GTM fields.
On Companies:
- Health band (Green / Amber / Red).
- Health score (0–100) if you have a quant model.
- PQA status (Not PQA / New PQA / Working / Disqualified).
- Expansion potential (Low/Med/High).
On Contacts:
- PQL status (Not PQL / New PQL / Working / Disqualified).
- Product role (Admin, Power user, Casual).
Compute these:
- In your warehouse or product analytics.
- Then sync into HubSpot as properties.
- Or via custom code/automation if simple rules.
These become routing and prioritization levers.
Step 5 – Implement a Robust Identity & Sync Layer
Connect product analytics with HubSpot via:
- Segment/Rudderstack → HubSpot Integration.
- Direct API calls from backend.
- Reverse ETL from warehouse (Hightouch, Census, etc.).
Key points:
- Use stable IDs (workspace/account ID, user ID).
- Map them to HubSpot IDs:
- product_workspace_id on Company.
- product_user_id on Contact.
Sync cadence:
- Critical signals (health, PQA) → at least daily.
- Heavy metrics (usage trends) → daily/weekly summaries.
Document:
- Which fields are source-of-truth in product/warehouse.
- Which are “HubSpot copies” for GTM use.
Step 6 – Route and Work PQLs/PQAs in HubSpot
Once signals are in HubSpot, build workflows.
PQL workflow (Contacts):
- Trigger: PQL status becomes New.
- Actions:
- Assign PLG AE or CSM based on segment/region.
- Create tasks: “Review usage and reach out to [Contact] at [Company].”
- Optional sequence enrollment based on role.
PQA workflow (Companies):
- Trigger: PQA status = New or PQA score crosses threshold.
- Actions:
- Alert account owner and relevant AE/CSM.
- Create tasks for account review and potential Expansion Deal.
- Log usage summary in notification (key stats pulled into email).
Sales & CS now see product-driven opportunities without leaving HubSpot.
Step 7 – Use HubSpot Playbooks to Add Context to Usage
Usage signals tell you that something’s happening; calls fill in why.
Create Playbooks for:
PQL/PQA follow-up calls.
- Who’s using the product, and for what?
- What’s blocking broader adoption?
- Is there budget and appetite for more?
Risk/health check-in calls.
- Reasons for low or dropping usage.
- Organizational changes.
- Support/gaps.
Map answers to HubSpot properties:
- Champion identified (Yes/No).
- Expansion initiative (Yes/No + notes).
- Retention risk reason.
This blends product data with qualitative insight in one record.
Step 8 – Build Dashboards That Show Product + Pipeline + Revenue Together
Dashboards for PLG/SaaS leadership:
Activation & PQLs
- Signups by source and segment.
- Activation rates (by feature thresholds).
- PQL/PQA counts and progression to opps/customers.
Usage & Health vs Revenue
- Accounts by Health band and MRR.
- Churn and expansion by prior Health band.
- Coverage: % of MRR in Green vs Amber vs Red.
Pipeline & Deals with Usage Context
- Deals with linked usage summary fields (e.g., active users, key features used).
- Win rate and ACV by usage level at opp creation.
Expansion & NRR
- Expansion MRR by motion (usage-triggered vs other).
- NRR/GRR by segment and plan.
- Expansion pipeline for high-usage accounts.
All of this runs inside HubSpot, powered by product data.
Step 9 – Keep HubSpot Lean: Avoid Turning It Into a Data Lake
Guardrails:
- Only sync fields that GTM teams will act on (e.g., for routing, prioritization, personalization, reporting).
- Avoid storing full clickstreams or per-user event histories.
- Archive or prune fields that don’t get used in workflows, lists, or dashboards.
RevOps should:
Maintain a short list of:
- “Product signals we surface in HubSpot.”
- Their definitions and owners.
Review them quarterly: keep what drives behavior; cut what doesn’t.
This keeps HubSpot fast and understandable.
Step 10 – Close the Loop: Use Combined Data to Improve Product and GTM
With product + GTM in one view, you can answer:
- Which features correlate most with conversion and retention?
- Which segments show strong usage but low expansion (pricing/packaging issue)?
- Which channels bring signups that never activate?
Use warehouse/BI for deep analysis, but:
Bring summarized insights back into HubSpot, e.g.:
- North star feature adopted? (Yes/No).
- Activation cohort tags.
- Propensity to expand scores.
Then adjust:
- PQL/PQA rules.
- Who sales-assists vs stays self-serve.
- Playbooks and messaging.
You get a closed loop between product analytics and GTM execution.
Want Help Combining Product Data with HubSpot Without Creating a Mess?
If product analytics, billing, and HubSpot are living in silos, we can help design a sane integration.
Through our HubSpot Implementation Blueprints, Portal Health Check, and Managed RevOps Retainer, we:
- Define the right account/user model and IDs to link systems.
- Decide which product/billing signals belong in HubSpot and at what granularity.
- Implement PQL/PQA, health, and usage fields + workflows.
- Build dashboards where product usage, pipeline, and MRR show up together.