

Total Revenue Is a Lagging, Blunt Instrument
Top-line revenue can be up while:
- Enterprise churn is creeping up.
- A key region is missing targets.
- SMB is growing but at poor unit economics.
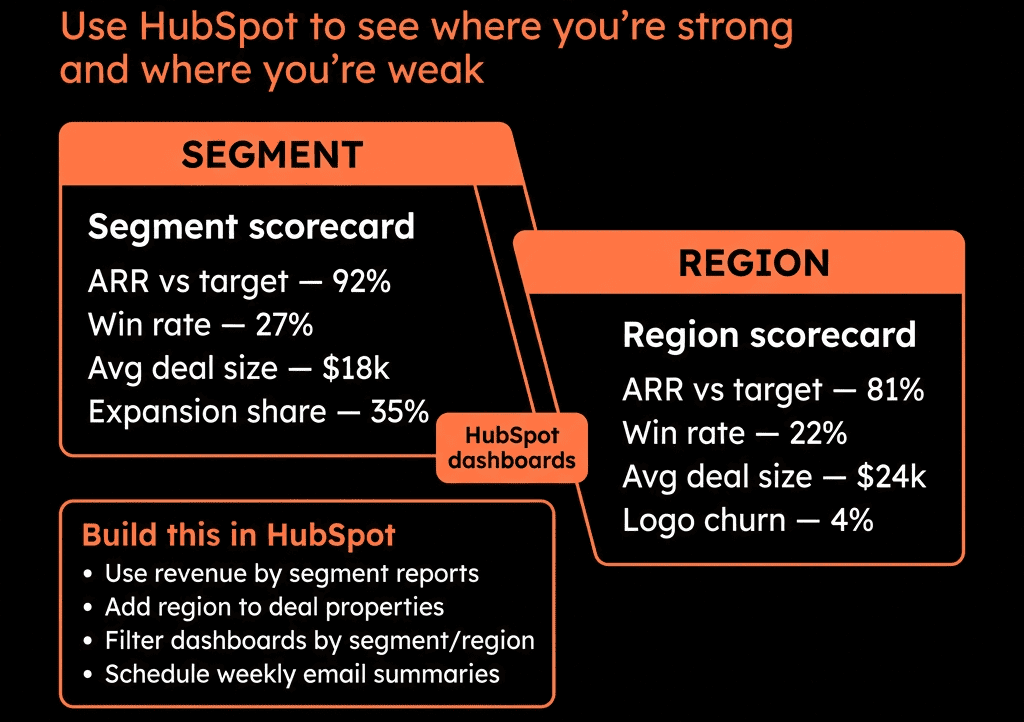
If you can’t slice revenue health by segment and region inside HubSpot, you’re flying partly blind.
We want a setup where you can open HubSpot and answer:
- Where are we winning?
- Where are we leaking?
- Which segments/regions should we push or protect?
Here’s how we structure that.
Step 1 – Define Your Segments and Regions in Business Terms
First, decide how you actually think about the business.
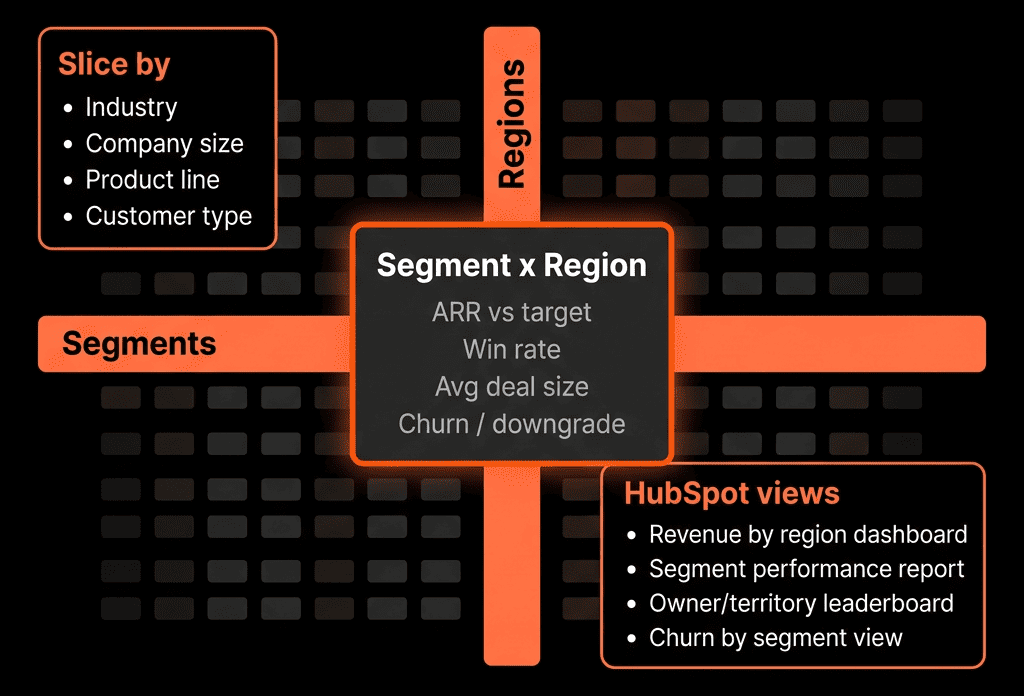
Common segment dimensions:
- Company size (SMB / Mid / Enterprise).
- Industry.
- Product line or use case.
- Customer tier (Standard / Strategic / High touch).
Regions:
- By geography (NAM, EMEA, APAC, LATAM).
- Or sub-regions (UK&I, DACH, NORAM, etc.).
- Or by GTM region/team if they differ from pure geography.
Write these as rules, not just labels. Example:
- Mid-market = 50–500 employees.
- Enterprise = 500+ employees.
- EMEA = Countries [UK, DE, FR, …].
You’ll translate these into properties and workflows.
Step 2 – Create Canonical Segment and Region Properties
On Companies (the right place for account-level segmentation), add:
- Segment (Dropdown): SMB / Mid-market / Enterprise / Strategic, etc.
- Region (Dropdown): NAM / EMEA / APAC / LATAM / etc.
- Industry (Dropdown or taxonomy aligned with your ICP).
- Customer tier (Optional: Standard / Strategic / Self-serve).
Also ensure you have:
- Number of employees (or Annual revenue) for size-based rules.
- Country (normalized).
Properties must be:
- Dropdown/select, not free-text.
- Documented in descriptions so admins and users know definitions.
Step 3 – Use Workflows to Auto-Assign Segment and Region
Don’t rely on manual updates. Automate:
Region
- Company-based workflow:
- Trigger: Country known AND Region unknown.
- Actions:
- If Country = US/CA → Region = NAM.
- If Country in [UK, DE, FR, …] → Region = EMEA.
- Etc.
Segment
- Company-based workflow:
- Trigger: Number of employees known AND Segment unknown.
- Actions (example):
- 1–49 → SMB.
- 50–249 → Mid 1.
- 250–999 → Mid 2 / Lower Enterprise.
- 1000+ → Enterprise.
- (Optional) Industry-specific overrides if needed.
Now every Company (and by association, its Deals) carries a consistent segment + region tag.
Step 4 – Ensure Deals Inherit Segment and Region Correctly
On Deals, you can either:
- Report using associated Company properties (preferred).
- Or maintain shadow properties (e.g., Deal segment, Deal region) synced from Company.
Set up:
- Deal-based workflow:
- When Deal associated with a Company whose Segment and Region are known → copy them to Deal properties (if you want copies).
Make sure:
- Every Deal is associated to the correct primary Company.
- Ownership and pipelines respect segment/region structures.
Now segmentation flows from accounts into pipeline and revenue.
Step 5 – Build New Business Revenue and Pipeline by Segment/Region
First lens: new logo / new business.
Key reports:
New business Closed Won by Segment and Region
- Filters:
- Deal type = New Business.
- Close date in period (month/quarter/year).
- Grouping:
- By Segment.
- By Region (or segment stacked by region).
New business pipeline by Segment and Region
- Filters:
- Deal type = New.
- Stage not Closed.
- Close date this + next period.
- Grouping:
- By Segment and/or Region.
- Optionally by stage to see depth.
This answers:
- Are we hitting new business targets in each segment and region?
- Do we have enough pipeline to sustain it?
Step 6 – Add Retention and Expansion Views by Segment/Region
To see full revenue health:
Renewals by Segment/Region
- Filters:
- Deal type = Renewal.
- Close date in period.
- Grouping:
- By Segment/Region.
- Show outcomes: Renewed, Churned, Downgraded (via Renewal outcome property).
Expansion by Segment/Region
- Filters:
- Deal type = Expansion.
- Close date in period.
- Grouping:
- By Segment/Region.
NRR/GRR by Segment/Region (if you track MRR/ARR in HubSpot)
- Use custom calculations or BI to show:
- Gross retention (GRR) by segment/region.
- Net retention (NRR) including expansion.
Now you see:
- Which segments/regions are healthy on retention.
- Where you’re landing but not expanding (or churning heavily).
Step 7 – Layer in Funnel and Win-Rate Metrics by Segment/Region
It’s not enough to know top-line numbers; you need why.
Reports:
Funnel conversion by Segment/Region
- Lead/MQL → SQL/Opportunity → Customer.
- Filter by Segment and/or Region.
Win rate by Segment/Region
- Deals created in period.
- Grouping:
- By Segment/Region.
- Metric: Closed Won / (Closed Won + Closed Lost).
Average deal size and cycle length by Segment/Region
- Show how long and how big deals are per slice.
Questions you can now answer:
- Is EMEA Enterprise slow but high value vs NAM SMB fast but low value?
- Where do we have strong conversion vs weak despite good top-of-funnel?
Step 8 – Add Source and Campaign Views by Segment/Region
Go one level deeper: what’s driving performance in each slice.
Examples:
Pipeline by Channel within each Segment/Region
- Group: Segment/Region + Channel (Original source).
- Metric: Deals created amount.
Closed Won by Campaign per Segment/Region
- Group: Revenue attribution campaign + Segment/Region.
Now you see:
- Which channels and campaigns work best in EMEA Enterprise vs NAM SMB.
- Where to focus or cut spend regionally.
Step 9 – Build a “Revenue Health by Segment & Region” Dashboard
Group the reports into one leadership-friendly view.
Sections:
Top-line by Segment/Region
- New, Renewal, Expansion Closed Won vs target.
- Pipeline for this + next period.
Win rate & deal size by Segment/Region
- Bar charts comparing segments/regions.
Retention & NRR by Segment/Region
- Renewal outcomes.
- Churn/expansion breakdown.
Funnel & source efficiency
- Conversion rates by Segment/Region.
- Channel/campaign performance per segment.
Set:
- Consistent date filters (this quarter vs last).
- Short descriptions per report (“What to look for here”).
- Use this dashboard in exec and regional reviews.
Step 10 – Use Insights to Drive Real GTM Decisions
Don’t stop at visibility.
Examples of decisions:
- Strong performance in Mid-market NAM, weak EMEA SMB:
- Shift marketing budget.
- Adjust territory assignments.
- Localise messaging for EMEA SMB or narrow ICP.
High churn in one segment:
- Revisit qualification and promises in that segment.
- Strengthen onboarding/CS plays.
High win rate but poor pipeline in a region:
- Increase demand gen or outbound focus there.
RevOps should:
- Document these findings quarterly.
- Pair them with recommended changes in:
- Targeting.
- Product packaging.
- Sales/CS coverage.
Want Help Turning HubSpot into a Real Segment & Region Health Monitor?
If your current HubSpot only shows global revenue and pipeline, we can help you build the segmentation and dashboards that leaders actually need.
Through our HubSpot Implementation Blueprints, Portal Health Check, and Managed RevOps Retainer, we:
- Design your segment and region model in properties and workflows.
- Ensure every account/deal is tagged and reportable.
- Build “Revenue Health by Segment & Region” dashboards for leadership.
- Use them with you in reviews to drive GTM decisions.
So you stop managing “the business overall”—and start managing the parts that are winning or leaking revenue.