

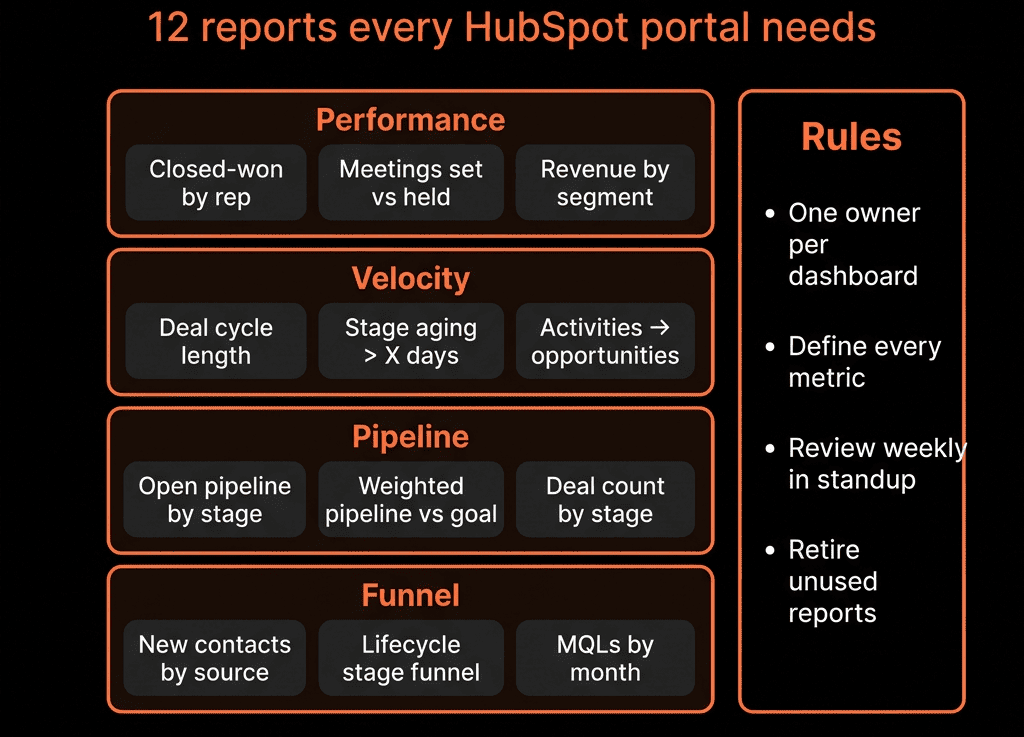
Don’t Start With 40 Dashboards. Start With 12 Reports That Matter.
Most portals either:
- Have almost no reporting.
- Or dozens of dashboards nobody uses.
We do the opposite.
We start with a minimal, opinionated stack of ~12 reports that:
- Cover the full funnel.
- Expose revenue and pipeline.
- Surface risk and performance by segment and owner.
You can add more later.
But these 12 give leaders a usable “reporting spine” from day one.
We group them into four categories:
- Revenue & pipeline
- Funnel performance
- Source & campaign impact
- Productivity & health
Use them to build 2–3 high-value dashboards.
Category 1 – Revenue & Pipeline
Report 1 – Closed Won Revenue vs Target (New / Renewal / Expansion)
Question: Are we hitting the number by motion?
Type: Deal report.
Filters:
- Date = Close date (this month/quarter).
- Stage = Closed Won.
Breakdowns:
- By Deal type (New, Renewal, Expansion).
- Optionally by team/owner.
Use with HubSpot Goals or manual targets to show:
- New business vs goal.
- Renewal/expansion vs goal.
Report 2 – Pipeline by Stage and Close Date (This + Next Period)
Question: Do we have enough real pipeline in the right stages?
Type: Deal report.
Filters:
- Deal stage not Closed Won/Lost.
- Close date in: this month/quarter and next month/quarter (separate views or comparison).
Grouping:
- By stage (stacked bars or funnel).
- Optionally segment by Pipeline or Deal type.
Shows:
- Where money sits in the funnel right now.
- If next period is under-built early enough to act.
Report 3 – Forecast vs Goal by Team/Rep
Question: What are we expecting to close vs target?
Assuming you use a Forecast category field and HubSpot’s Forecast tool:
Type: Deal report or built-in Forecast view.
Filters:
- Close date in this period.
Grouping:
- By owner / team.
- By Forecast category (Pipeline, Best, Commit).
Visual:
- Stacked bars: Commit + Best vs target.
Used weekly in revenue standups.
Category 2 – Funnel Performance
Report 4 – Lead → MQL → SQL/Opportunity → Customer Funnel
Question: How efficiently do we move people from lead to revenue?
Type: Contact + Deal funnel (or separate reports if needed).
Stages:
- Contacts: Lead → MQL → SQL (or Opportunity).
- Deals: Deal created → Closed Won.
Filters:
- Date = contact create date or MQL date, depending on your lens.
- Optionally by segment (industry, size, region).
Outputs:
- Volumes and conversion rates at each step.
- The “where are we leaking?” baseline.
Report 5 – MQL to Opportunity Conversion by Owner/Team
Question: Are MQLs being worked and accepted?
Type: Multi-object or two-step analysis.
Filters:
- Contacts that became MQL in period.
Groupings:
- By Contact owner or SDR/AE owner.
Show:
- Count of MQLs.
- Count (and %) that have associated Deals created within X days.
Highlights:
- Which reps/teams convert MQLs to real opportunities.
- Where leads are ignored or recycled.
Report 6 – Stage-to-Stage Conversion and Time in Stage
Question: Where do deals stall and die?
Two parts:
Stage conversion
- Type: Deal funnel.
- Stages: all open → Closed Won.
- Filters: deals created in last X months.
Time in stage
- Type: Deal report.
- Grouping: average days in each stage.
Shows:
- Stages with low forward conversion.
- Stages where deals sit too long.
These drive pipeline design and coaching.
Category 3 – Source & Campaign Impact
Report 7 – Pipeline and Revenue by Channel/Source
Question: Which channels actually create pipeline and revenue?
Type: Deal report (linked to Contact/Company source).
Filters:
- Deals created in the period (for pipeline).
- Closed Won in the period (for revenue).
Grouping:
- By Original source or a normalized Channel property.
Outputs:
- Deals created by channel (count and amount).
- Closed Won by channel.
Combined: which channels drive real opportunities and revenue, not just traffic.
Report 8 – Campaign Performance Across the Funnel
Question: Which campaigns drive leads, opps, and revenue?
If you use HubSpot Campaigns properly:
- Use built-in Campaign reports for:
- New contacts.
- Influenced deals.
- Attributed revenue.
If not, use your own Campaign properties:
- Type: Multi-stage report.
- Grouping:
- By Lead creation campaign / Opportunity source campaign / Revenue attribution campaign.
Show per campaign:
- New contacts.
- MQLs.
- Opportunities created.
- Revenue (Closed Won).
This is the foundation for marketing ROI conversations.
Category 4 – Productivity & Health
Report 9 – Activities vs Outcomes by Rep
Question: Who is effective, not just busy?
Type: Activity + Deal summary report.
Filters:
- Date = last 30/90 days.
Metrics per rep:
- Calls made.
- 1:1 emails sent.
- Meetings held.
- New deals created.
- Closed Won amount.
You can add:
- Connection rate (connected calls / total calls).
- Meetings per 100 calls/emails.
Use for coaching and resourcing, not to chase vanity activity targets.
Report 10 – SLA and Speed-to-Lead
Question: How fast do we respond to interested buyers?
Assuming you track MQL date or form submit date + first contact timestamp:
Type: Contact report.
Metrics:
- Time from MQL (or form) → first logged sales activity (call/email/meeting).
Views:
- Average and distribution.
- % of MQLs contacted within X hours (e.g., 2 / 24).
Segment by:
- Channel.
- Owner/team.
This tells you if routing and follow-up workflows work in practice.
Report 11 – Stalled Pipeline and Next Step Hygiene
Question: How much of our pipeline is quietly dead?
Type: Deal report.
Filters:
- Stage not Closed.
- Last activity date older than X days (stage-specific).
- Or Next step date in the past.
Grouping:
- By owner and stage.
Show:
- Count and amount of “stalled” deals.
- Stalled pipeline % by stage.
Add a simple hygiene KPI:
- % of open deals with Next step + Next step date populated.
Report 12 – Retention and Expansion Snapshot (If Applicable)
Question: What’s happening after the first sale?
If you track renewals/expansion in HubSpot:
Type: Deal report.
Filters:
- Deal type = Renewal or Expansion.
- Close date in last quarter / year.
Grouping:
- By outcome (Renewed, Churned, Downgraded, Expanded).
- By segment (industry, size, region).
Metrics:
- GRR and NRR (if you maintain MRR/ARR properties).
- Expansion vs churn by segment.
This complements new business reports to give a full revenue view.
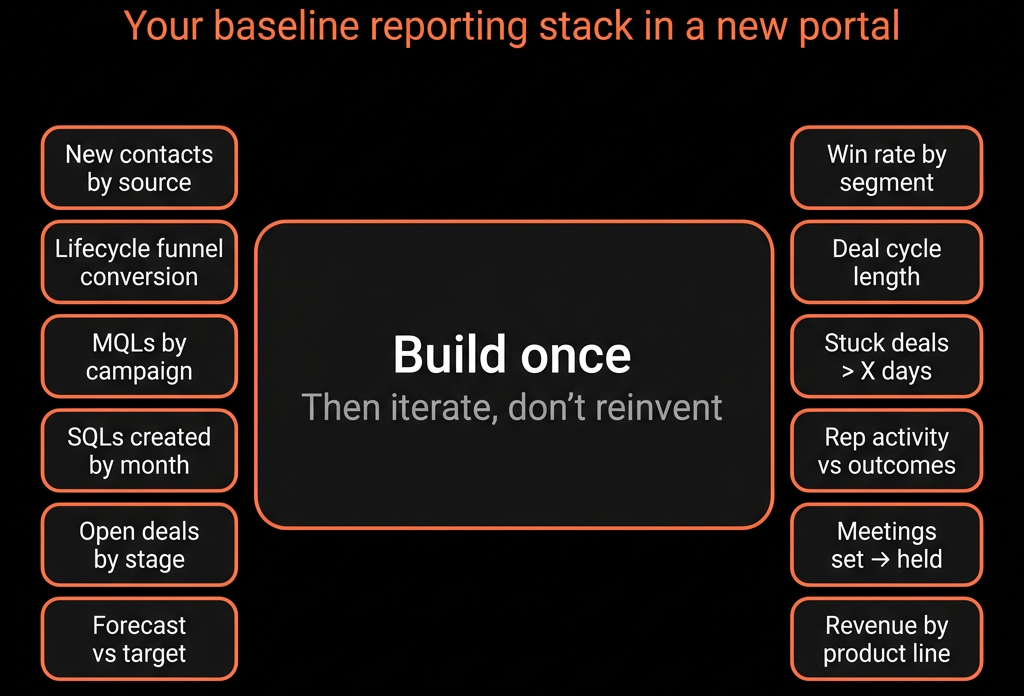
How We Turn These 12 Reports Into Dashboards
We typically create 3–4 dashboards:
Executive Revenue Overview
- Reports 1, 2, 3, 12.
Funnel & Source Performance
- Reports 4, 5, 6, 7, 8.
Sales Productivity & Pipeline Health
- Reports 9, 10, 11.
(4. CS & Renewals if you’re mature there.)
Each dashboard:
- Uses consistent date filters (e.g., this quarter vs last).
- Has short descriptions on key reports (what, why).
- Is used live in leadership + GTM meetings (no exports).
Once these are solid, you can add more nuanced reports as needed.
Want These 12 Reports (and Dashboards) Built on Top of Your Existing HubSpot?
If your current reporting feels noisy, fragmented, or spreadsheet-heavy, a lean, opinionated reporting stack is usually the fastest win.
Through our HubSpot Portal Health Check, Implementation Blueprints, and Managed RevOps Retainer, we:
- Audit your current data model, pipelines, and reports.
- Implement or clean up the properties and workflows needed for these 12 reports.
- Build the dashboards so leadership and GTM teams can run meetings directly from HubSpot.
- Extend the stack gradually based on your GTM model (PLG, partner, CS-heavy, etc.).
So you don’t drown in charts—you get the few reports that actually run the business.