

If You Only Look at Pipeline or Utilization, You’re Half Blind
Typical pattern in services firms:
- Sales/leadership obsess over pipeline.
- Ops/PMs obsess over utilization and delivery.
- They don’t look at both together.
Result:
- Over-selling and burning teams out.
- Under-selling and leaving capacity idle.
- No clear answer to “Do we have room for this project?” or “When do we hire?”
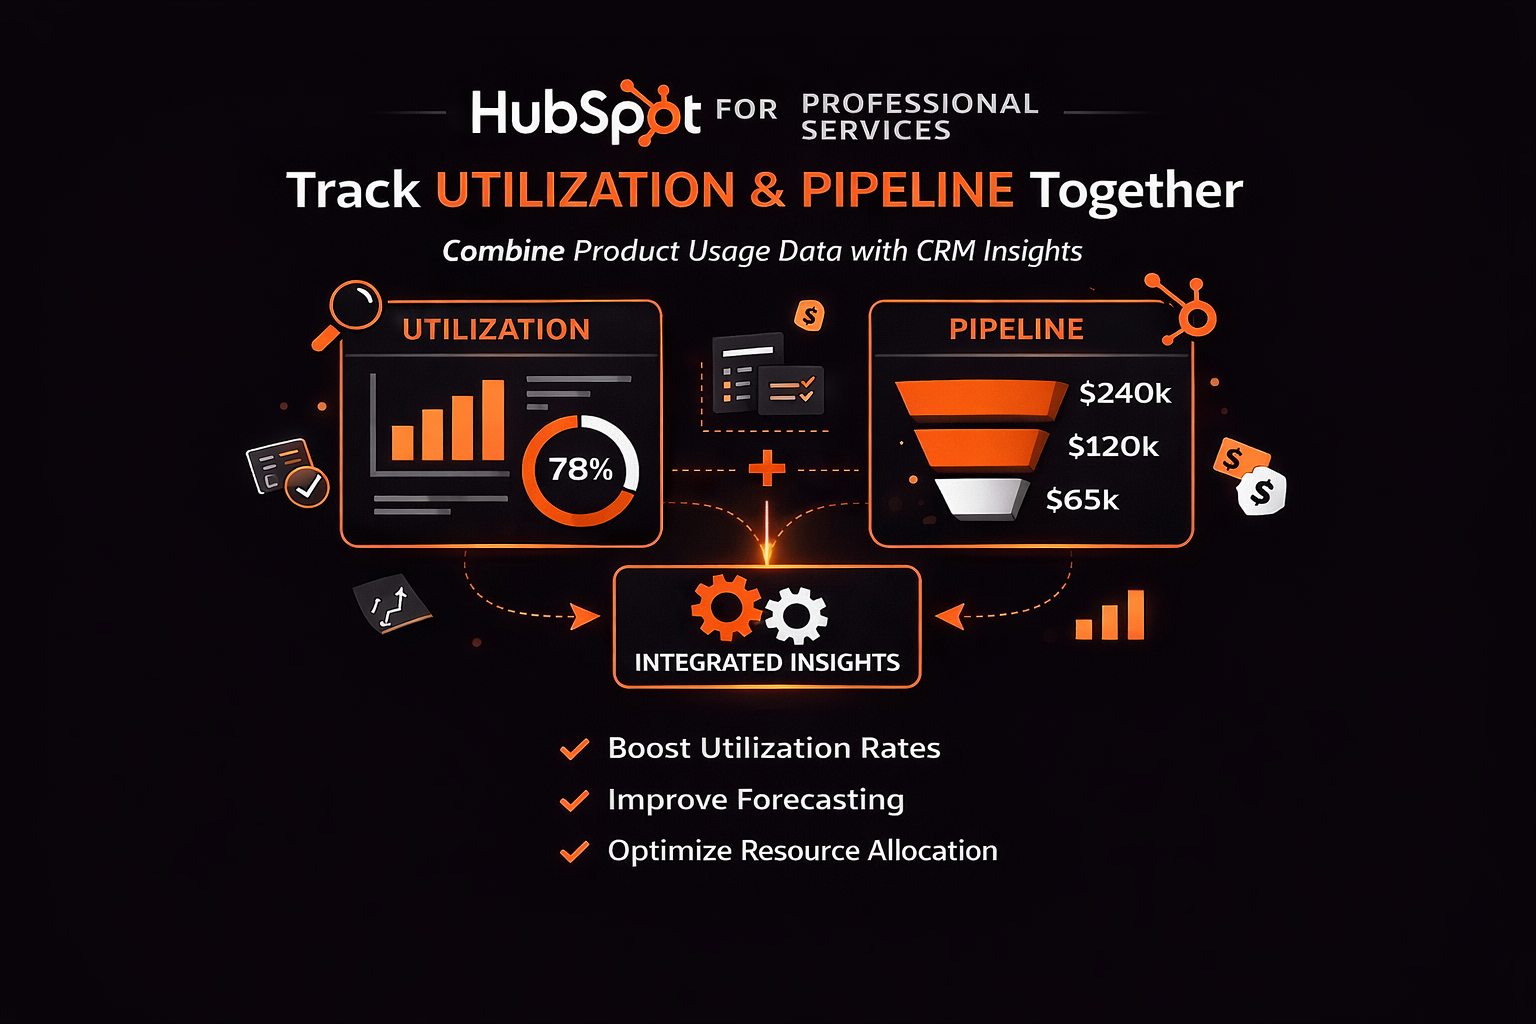
HubSpot can be the pipeline and revenue side of that equation and consume just enough delivery/usage data to inform decisions.
Here’s how to structure it.
Step 1 – Standardize How You Model Work in HubSpot
Use:
- Companies = clients.
- Deals = revenue-carrying engagements:
- New projects/implementations.
- Retainers/managed services.
- Expansions.
On Deals:
- Deal type (New project, Retainer, Expansion, Renewal).
- Service line (Strategy, Implementation, Support, etc.).
- Expected start date.
- Expected end date (or duration in weeks/months).
- Revenue model: Fixed-fee vs T&M vs MRR.
- Total value and/or MRR.
This gives you time-bound revenue you can overlay with utilization.
Step 2 – Represent Capacity and Utilization in a Simple Way
You’ll usually track detailed utilization in:
- Time tracking / PSA tools (e.g., Harvest, Forecast, Mavenlink, etc.).
From there, sync summary data into HubSpot:
On a Team Member custom object or as Users/properties:
- Role (Consultant, Engineer, Designer, PM).
- Billable capacity per week (hours or %).
- Current utilization % (rolling 4 weeks or this month).
On Companies or Deals (optional, high-level):
- Allocated FTEs (approximate).
- Or tags by delivery team/squad.
You don’t need every hour in HubSpot—just enough to judge load vs demand.
Step 3 – Use Deals to Forecast Delivery Demand
With Expected start date and Duration, you can:
- Group Deals by start month and service line.
Approximate needed capacity per role:
Example approach:
- Add a simple property on Deals:
- Estimated delivery effort (consultant days) or a band (Small/Med/Large).
- Or a custom breakdown:
- Consulting days, Engineering days, etc. (rough estimates).
These estimates + start/end dates let you create:
- “Workload by month” per role/service using HubSpot reports or by exporting to a spreadsheet/BI.
Step 4 – Create a Pipeline That Reflects When Deals Hit Delivery
Stages for projects might look like:
- Qualified opportunity.
- Proposal / SOW out.
- Verbal commit.
- Closed Won – In planning.
- In delivery.
- Completed.
For retainers/managed services:
- New.
- Active.
- Renewal in review.
- Renewed / Ended.
Use stage + Expected start date to see:
- Committed work (Closed Won with dates).
- Probable work (later stages with reasonable probability).
- Early-stage pipe (for marketing/sales planning).
Step 5 – Connect Time/PSA Data Back to HubSpot at the Right Level
From your delivery tool, send to HubSpot:
On Deals:
- Actual start date.
- Actual end date (when completed).
- Delivery status (Not started / In progress / At risk / Completed).
- Actual hours / Actual margin bands (optional, for profitability).
On Clients (Companies):
- Last project closed date.
- Total revenue last 12 months (band).
- Health (Green/Amber/Red), if you maintain a client health model.
Now HubSpot shows both forward-looking demand and a backward-looking performance lens.
Step 6 – Build Dashboards That Show Pipeline + Capacity Together
In HubSpot (or via export to BI) build views like:
Future Workload vs Capacity
- Deals by Expected start date and Estimated effort by service line.
- Overlay (or compare) with team capacity by month (from your PSA).
Hotspots & Gaps
- Months with >100% forecasted load in key roles.
- Months with <70% expected utilization (sell more or adjust staffing).
Revenue Mix & Utilization
- Revenue by service line vs average utilization of associated teams.
- E.g., Implementation at 110% utilization; Strategy at 60%.
Leadership can then decide:
- Where to throttle sales/discounting.
- Where to invest in marketing.
- When to hire or reassign.
Step 7 – Use HubSpot for “Can We Take This Work?” Checks
As deals approach the late stages:
- Create a simple Deal view for sales/partners that includes:
- Expected start date.
- Duration / Effort band.
- A field pulled from your PSA: Capacity status for month (OK / Tight / Overloaded).
Before moving Deals to Verbal commit or Closed Won, sales/partners:
- Check this view, or
- Trigger a quick internal review with delivery leads.
This avoids over-selling and unplanned weekend work.
Step 8 – Tie Utilization & Pipeline to Hiring Decisions
From combined data:
Identify sustained periods (3–6 months) where:
- Pipeline + committed work > X% of capacity (e.g., >90%).
Also watch for:
- Underutilized roles where pipeline is consistently thin.
Use HubSpot to:
Slice by:
- Service line.
- Client segment.
- Geography.
Then you can say:
- “We need another Senior Dev in EMEA to support Q3-Q4 pipeline.”
- “We should push more data projects; data team is underutilized.”
HubSpot becomes an input to workforce planning, not just BD.
Step 9 – Keep GTM, Delivery, and Finance Talking From the Same Numbers
Set a cadence:
Weekly:
- Sales + Delivery check:
- New Deals nearing close.
- Changes in start dates.
- Delivery risk status (from PSA into HubSpot).
Monthly:
- Leadership review of:
- Revenue targets vs pipeline.
- Utilization vs forecasted workload.
- Client health and expansion opportunities.
Even if the exact utilization metrics live in PSA/BI, use HubSpot for:
- The high-level “do we have enough / too much work?” layer.
Step 10 – Don’t Overstuff HubSpot With Delivery Detail
Guardrails:
- Keep detailed planning, resourcing, and timesheets in PSA/project tools.
- Keep HubSpot focused on:
- Deals (what’s being sold, when, and for how much).
- Basic effort and timing estimates.
- High-level delivery status and health.
When tempted to sync more into HubSpot, ask:
- “Will sales/CS/leadership actually act on this here?
- Or is it just nice-to-have?”
If it’s not driving a decision, leave it in PSA/BI.
Want Help Connecting Pipeline and Utilization Using HubSpot?
If your current world is: HubSpot for pipeline, PSA for utilization, and spreadsheets to connect them, we can help design a cleaner approach.
Through our HubSpot Implementation Blueprints, Portal Health Check, and Managed RevOps Retainer, we:
- Standardize your services data model and Deal fields for timing and effort.
- Integrate high-level utilization and delivery signals from PSA into HubSpot.
- Build dashboards that show pipeline and capacity together.
- Help leadership use these views for selling, scoping, and hiring decisions.