

If Marketing Wins and Sales Loses, Nobody’s Really Winning
Marketing reports:
“Leads are up 40%.”
Sales reports:
“Pipeline quality is down, win rates are flat.”
Same HubSpot portal.
Different scoreboards.
Alignment doesn’t start with a workshop.
It starts with shared definitions, shared data, and shared dashboards.
Here’s how we use HubSpot to align marketing and sales KPIs around revenue.
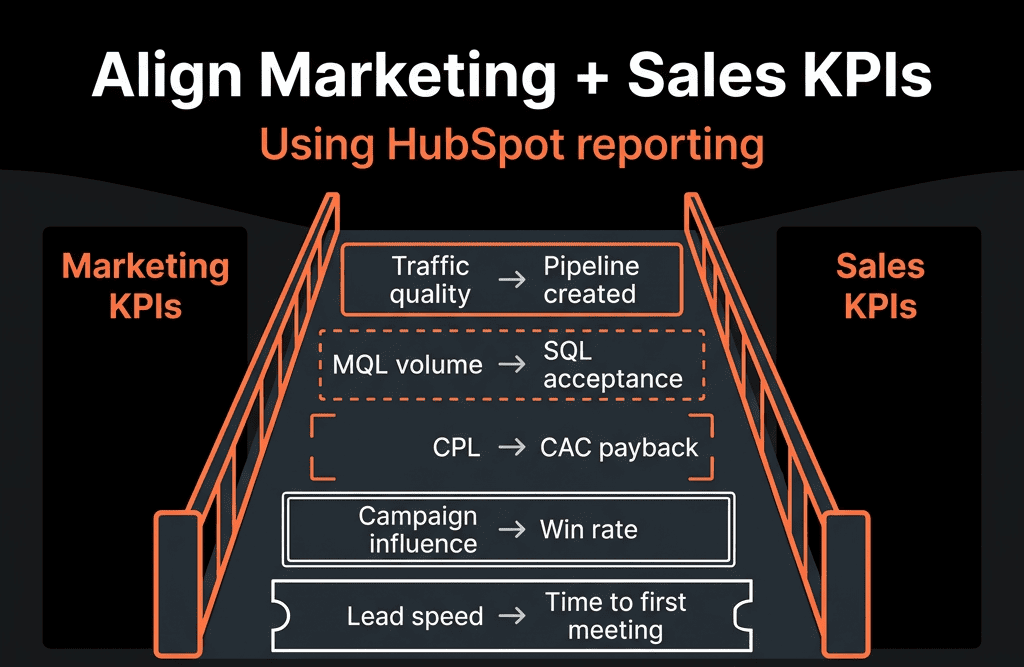
Step 1 – Agree on a Shared Funnel and Definitions in HubSpot
Before touching reports, you need one funnel model.
In HubSpot:
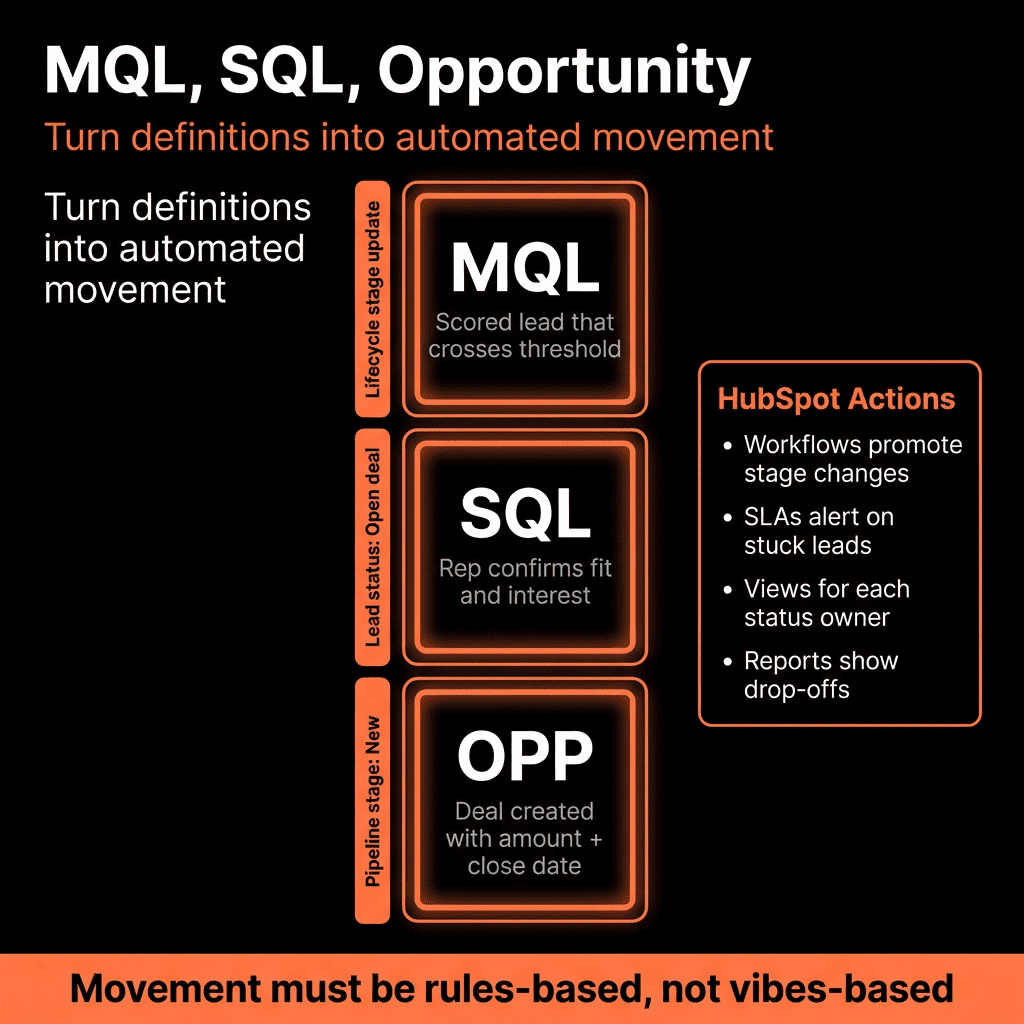
Standardize Lifecycle stages
Typical B2B set (adjust names, not meaning):
- Subscriber
- Lead
- MQL
- SQL / Opportunity
- Customer
- Evangelist / Other
Standardize Lead status for sales-owned contacts
- New
- Open
- In progress
- Connected
- Qualified
- Disqualified
Define hand-off points in writing:
- When is someone counted as an MQL?
- When does Sales accept and move to SQL/Opportunity?
- What are the minimum data requirements at each step?
Once lifecycle and handoffs are clear, KPIs can align around the same milestones.
Step 2 – Map Marketing + Sales KPIs to the Same Milestones
We then tie departmental KPIs to shared funnel stages, not separate worlds.
Examples:
At the MQL stage
Marketing KPIs:
- MQL volume by segment.
- MQL-to-SQL conversion rate.
Sales KPIs:
- MQL response time.
- MQL acceptance rate.
At the SQL / Opportunity stage
Marketing KPIs:
- MQL-to-opportunity conversion by source/campaign.
Sales KPIs:
- Opportunity creation rate from accepted MQLs.
- Stage progression speed.
At the Customer stage
Shared KPIs:
- Pipeline and revenue sourced/influenced by channel/campaign.
- Win rate by segment and source.
Every KPI should map to a HubSpot property and stage transition.
Step 3 – Clean the Minimum Data Needed for Shared Reporting
You don’t need perfect data; you need consistent minimums:
On Contacts:
- Lifecycle stage
- Lead status
- Original source (and drilled-down or normalized channel)
- Persona / segment fields (industry, company size, etc.)
On Deals:
- Pipeline
- Deal stage
- Amount, Close date
- Deal type (New / Renewal / Expansion)
- Association to correct primary company and primary contact
Use simple workflows to:
- Auto-align lifecycle with deal creation and Closed Won.
- Backfill missing lifecycle/lead status where rules are obvious.
- Normalize sources into a clean “Channel” property if needed.
This gives both marketing and sales the same underlying truth.
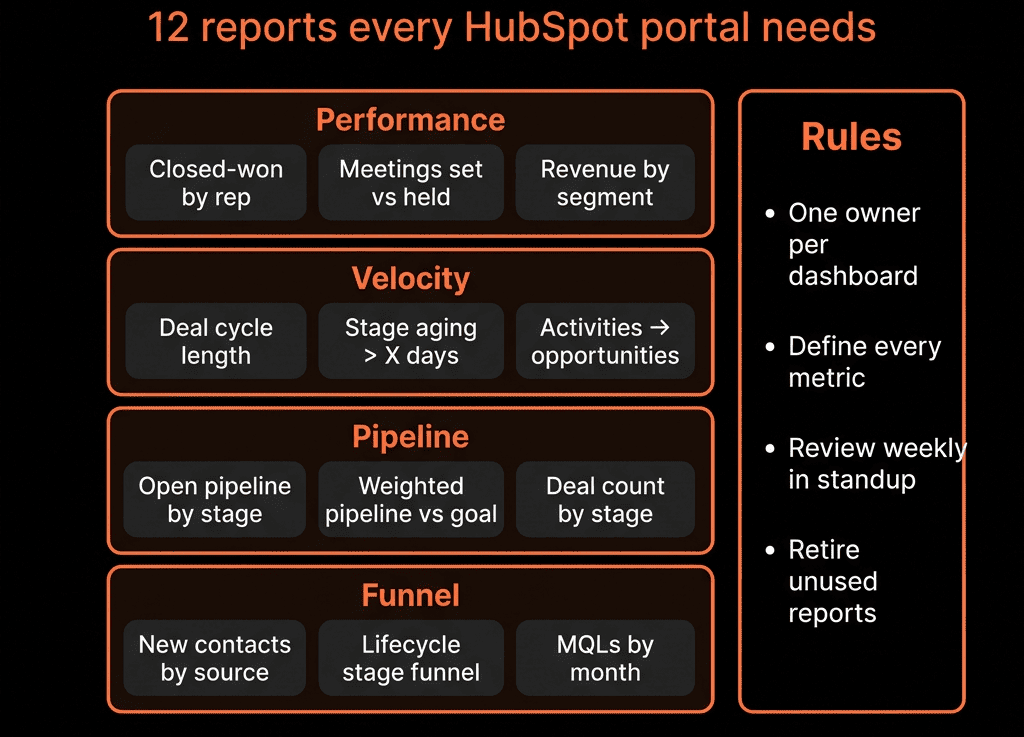
Step 4 – Build a Shared Funnel Performance Dashboard
This is the “single source of truth” KPIs dashboard.
Key reports:
Funnel: Lead → MQL → SQL/Opportunity → Customer
- Contact-based and/or combined with deals.
- Show conversion rates and volumes per period.
MQL-to-SQL conversion by owner/team
- Contacts: Lifecycle = MQL (in period) → SQL created/accepted.
- Highlights whether the issue is quantity or follow-up.
Opportunity-to-Customer conversion
- Deals created → Closed Won rate, by pipeline and segment.
Average time between stages
- Lead to MQL.
- MQL to SQL.
- SQL to Closed Won.
This dashboard becomes the backbone of monthly / quarterly RevOps reviews.
Step 5 – Build Source & Campaign Alignment Reports
Next, we align on where good leads and revenue come from.
Reports we use:
Contacts by channel → Lifecycle stage
Columns: channel.
Series: Leads, MQLs, SQLs, Customers.
Shows channels that look good on volume but weak on revenue.
Opportunities and revenue by channel
Deals created by channel.
Closed Won amount by channel.
Campaign performance across the funnel
With HubSpot Campaigns or your own attribution fields:
Contacts → MQLs → Opportunities → Customers per campaign.
Closed Won revenue per campaign.
Shared KPIs now look like:
Marketing: MQL volume and MQL→Opportunity conversion by channel/campaign.
Sales: Win rate and deal size by channel/campaign.
Both teams optimise the same channels, just at different points in the funnel.
Step 6 – Create “Handoff Health” Dashboards
Most misalignment happens at the handoff.
We make that visible.
Useful reports:
MQL SLA compliance
Time from MQL created to:
- First sales activity (call/email/meeting).
- % of MQLs touched within X hours.
MQL acceptance rate
- MQLs that progressed to SQL/Opportunity within a set window.
- By owner, team, and segment.
Recycled/Disqualified reason analysis
- Contacts moved back from SQL/Opportunity or disqualified.
- Reasons by campaign/channel.
These KPIs are shared:
Marketing sees if they are sending leads Sales can work.
Sales sees if they are following up and qualifying properly.
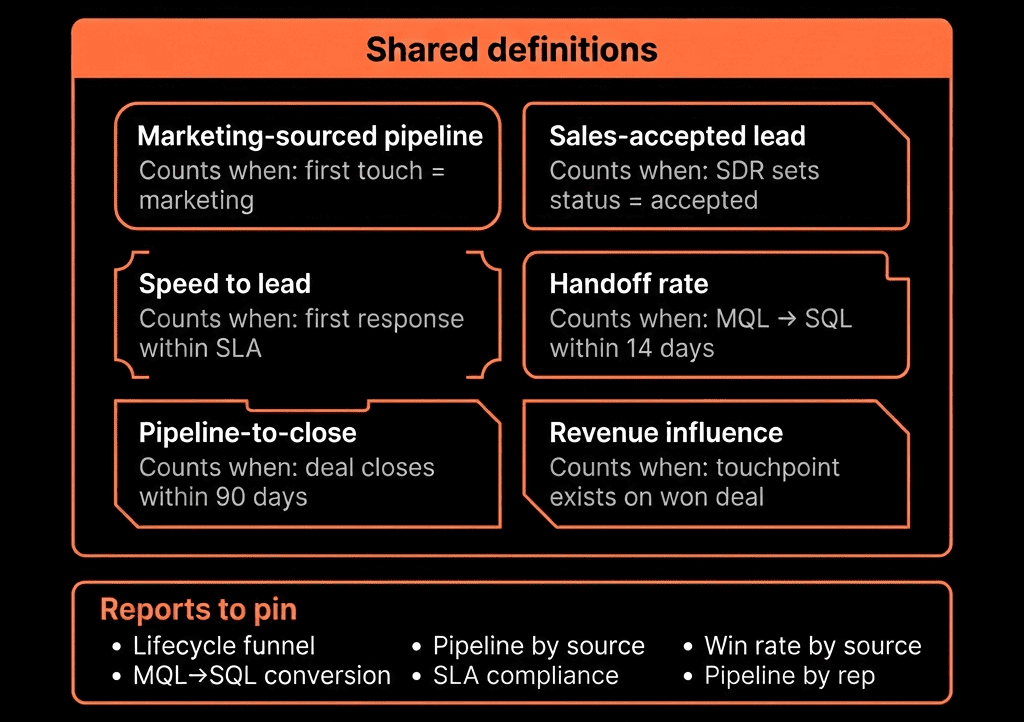
Step 7 – Give Marketing Access to Sales KPIs, and Sales Access to Marketing KPIs
Alignment breaks when one side only sees their own numbers.
In HubSpot:
Give marketing access to:
- Pipeline dashboards.
- Win/loss reports by source and campaign.
- Sales activity reports for MQLs.
Give sales access to:
- Campaign performance dashboards.
- Channel-level funnel reports.
- Lead source quality metrics.
We then run shared reviews:
Monthly marketing + sales sync around these same dashboards.
Quarterly revenue reviews (QBRs) with leadership, all in HubSpot.
The conversation shifts from “your leads vs our follow-up” to “one funnel, where’s the leak?”
Step 8 – Standardise Exec KPIs on HubSpot, Not Slides
Executives should see one KPI set, not separate marketing and sales decks.
We build an exec-facing dashboard that surfaces:
- New pipeline & revenue by segment and source.
- MQL volume and MQL→Opportunity conversion.
- Win rate and average deal size by segment and channel.
- NRR / GRR (if you’re tracking renewals/expansion).
Marketing and sales leaders each have sub-dashboards, but the exec view is shared.
If a KPI doesn’t exist in HubSpot, we question whether it’s the right KPI.
Step 9 – Turn Misaligned Metrics Into Concrete HubSpot Changes
When misalignment shows up in reports, fix it in process and configuration.
Examples:
Lots of MQLs, low acceptance:
- Tighten MQL criteria.
- Adjust forms and scoring.
- Build better sales context into MQL alerts.
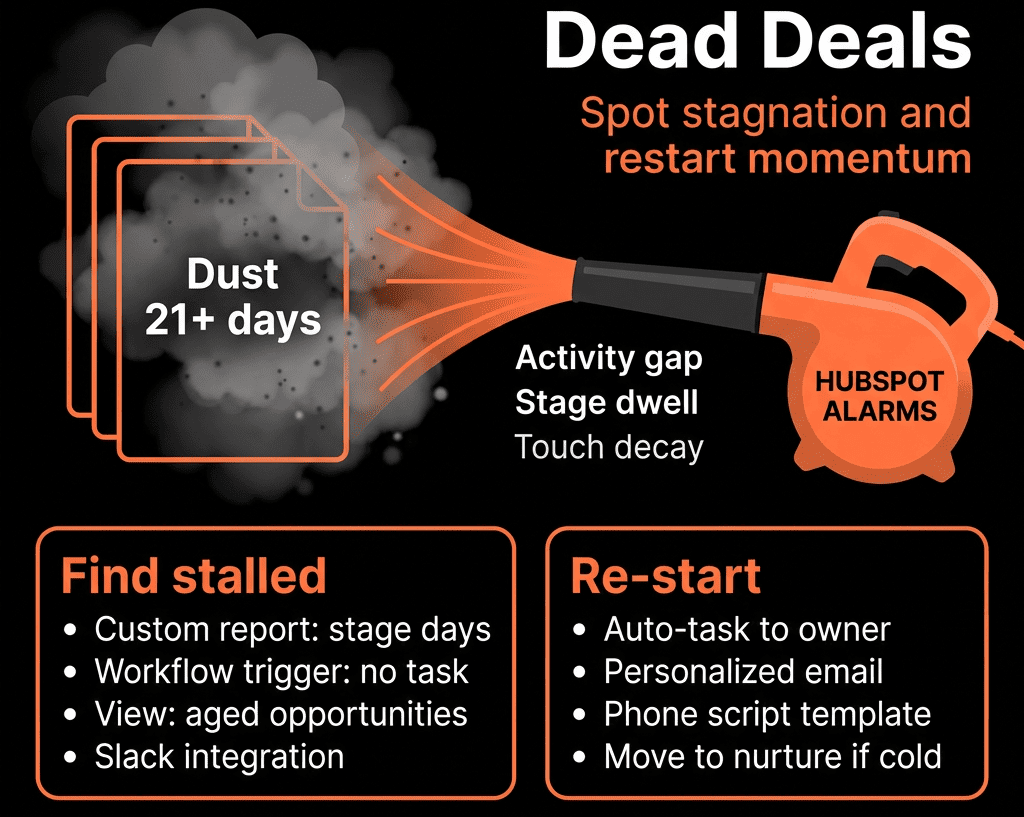
Slow MQL follow-up:
- Introduce SLA workflows and task creation.
- Create rep/manager dashboards for SLA breaches.
High volume from a channel, low win rate:
- Adjust targeting and messaging.
- Narrow persona.
- Potentially down-weight or pause that channel.
Changes should be implemented in HubSpot (properties, workflows, routing, scoring, dashboards), not just agreed verbally.
Step 10 – Review KPIs Together, Regularly
Finally, make alignment a cadence, not an event.
We recommend:
Weekly ops sync:
- Check handoff health, MQL follow-up, and obvious leaks.
Monthly GTM sync:
- Marketing + Sales + CS with funnel and source reports.
Quarterly revenue review:
- Execs and GTM leaders.
- Use exec + funnel + attribution dashboards only.
Same system.
Same data.
Different lenses—but one revenue story.
Want Help Designing One KPI Framework for Both Marketing and Sales?
If your marketing and sales reports tell different stories, HubSpot is usually not the problem—the architecture is.
Through our HubSpot Portal Health Check and Managed RevOps Retainer / Migration & ROI Plan, we:
- Audit your lifecycle, lead status, and pipeline setup.
- Design a shared KPI and reporting framework across marketing and sales.
- Implement the required properties, workflows, and dashboards.
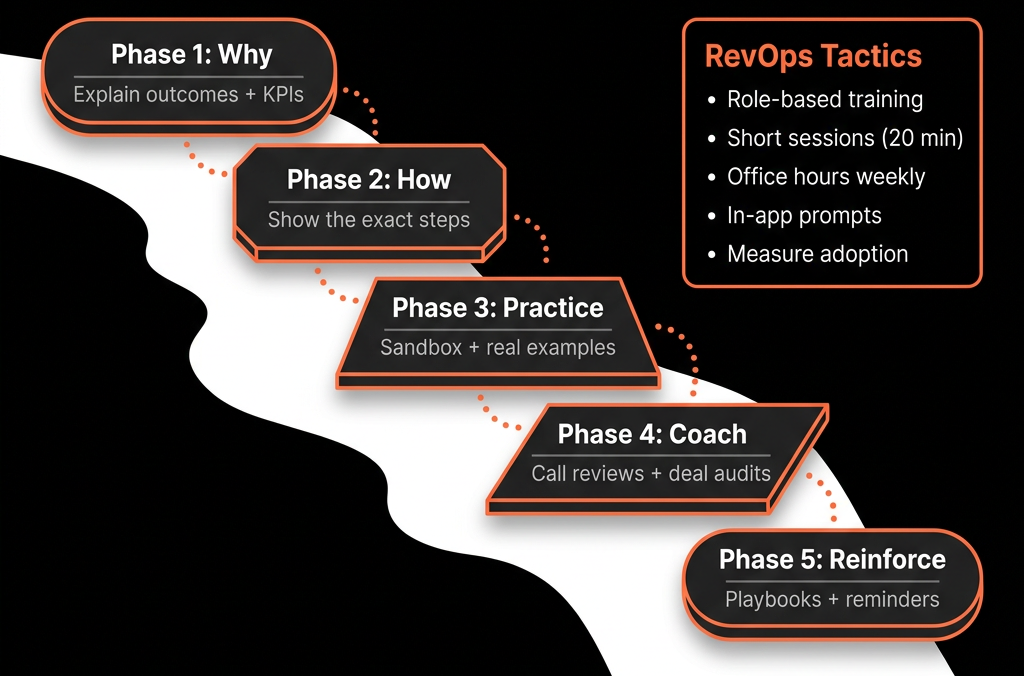
- Train both teams to read the same numbers and act on them.
- So everyone stops arguing about the data—and starts fixing the same funnel.
- Make sure dont miss any word