

Boards Don’t Care About “HubSpot Data” — They Care About a Coherent Revenue Story
Before board meetings, most teams:
- Export from HubSpot.
- Rebuild everything in spreadsheets.
- Manually reconcile with finance.
It’s slow. Error-prone. And it signals that HubSpot is “directional” at best.
You don’t need the board to log into HubSpot.
You do need HubSpot to provide clean, reconciled inputs for board packs and investor updates.
That means:
- A revenue data model that matches how you report to the board.
- A small set of board-aligned dashboards.
- A repeatable process to reconcile HubSpot with finance.
Here’s how we set that up.
Step 1 – Align the Revenue Model in HubSpot With the Board’s View
Start with how you already talk to your board:
Typical dimensions:
- Motions: New business, renewals, expansion.
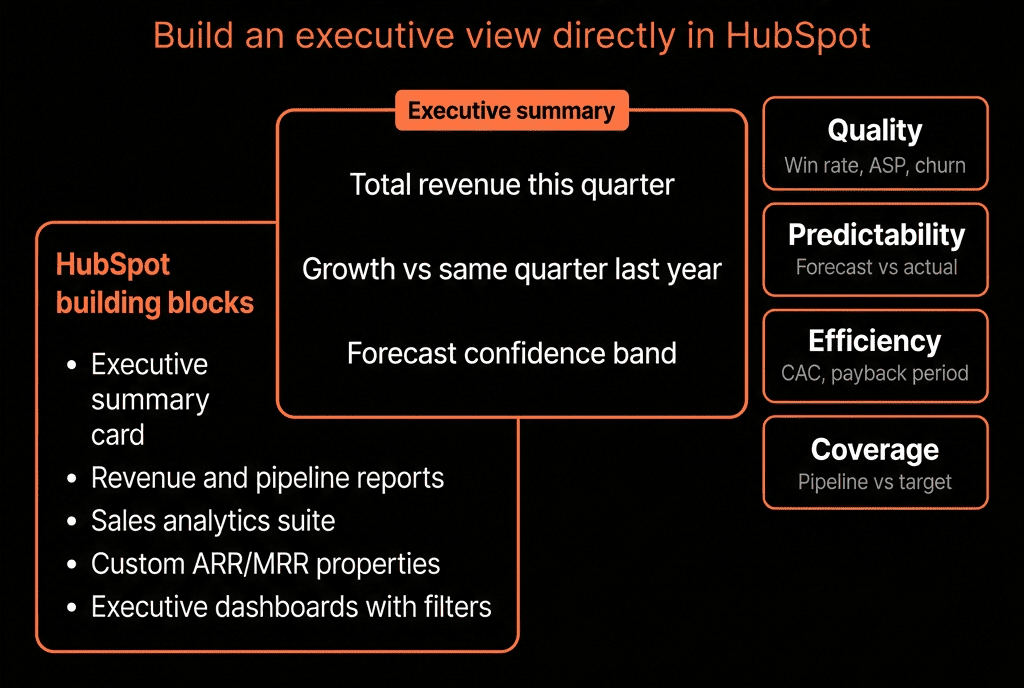
- Time: Monthly/quarterly recurring revenue, bookings, ARR/MRR.
- Segments: SMB / Mid / Enterprise, or by region/industry.
- Health: NRR/GRR, churn, expansion.
- Funnel & efficiency: pipeline coverage, CAC/efficiency proxies.
Map this back to HubSpot:
On Deals:
- Deal type (New / Renewal / Expansion).
- MRR / ARR (if subscription model).
- Product / line of business (if you split that way).
- Segment and Region (synced from Company).
On Companies (for account-level views):
- Customer status (Prospect, Active, Churned).
- Current MRR/ARR.
- Segment, Region, Industry.
This lets HubSpot mirror the board-level revenue structure.
Step 2 – Decide What HubSpot Owns vs What Finance Owns
Boards need booked and recognized revenue. HubSpot tracks commercial motions.
Define:
HubSpot is the system of record for:
- Opportunities and bookings.
- Pipelines (New/Renewal/Expansion).
- Sales, marketing, and CS activity & funnel.
Finance/ERP is the system of record for:
- Actual billings and recognized revenue.
- Cash, margins, detailed P&L.
Then:
- Sync from finance into HubSpot only the fields needed for board views, e.g.:
- Billing status (Active, Delinquent, Canceled).
- Contracted MRR/ARR per customer.
- Contract start/end.
Board decks then combine:
- Bookings/pipeline from HubSpot.
- Recognized revenue from finance.
But the dimensions (segment, region, product) stay consistent.
Step 3 – Clean Up Pipelines and Stages for Board-Grade Reporting
You can’t explain revenue to a board if your pipelines are messy.
Stabilize:
Separate pipelines for:
- New Business.
- Renewals.
- Expansion/Upsell.
Stages reflect buyer commitments, not internal to-dos.
Entry/exit criteria written down and trained on.
This supports:
- Clear bookings reporting by motion.
- Reliable pipeline coverage metrics.
- Honest forecast conversations.
Step 4 – Ensure Every Deal Is Properly Typed, Segmented, and Dated
Board questions like “How is Enterprise doing in EMEA?” depend on this.
For each Deal:
- Deal type must be accurate (New vs Renewal vs Expansion).
- Amount and Close date must reflect reality.
- Segment and Region synced from Company.
- Pipeline and stage tracked correctly.
Use workflows to:
- Auto-set Deal type where rules are clear (e.g., pipeline = Renewals → Deal type = Renewal).
- Copy Segment and Region from Company on deal creation.
- Flag missing/invalid values before quarter-end closes.
This is the “data hygiene tax” you pay to have confidence in board numbers.
Step 5 – Build a Board-Facing Revenue Dashboard Pack
You don’t need many dashboards. You need a few that line up with board slides.
We usually build a “Board – Revenue Overview” folder with:
Dashboard 1 – Revenue & Bookings
- Reports:
- New, Renewal, Expansion Closed Won by period vs target.
- Bookings by segment and region.
- Trend of total ARR/MRR (from finance sync or HubSpot fields).
Dashboard 2 – Pipeline & Forecast
- Reports:
- Pipeline by stage for next 1–2 quarters (New/Renewal/Expansion).
- Forecast vs target by team.
- Coverage ratios (pipeline / target) by segment/region.
Dashboard 3 – Retention & NRR
- Reports:
- Renewal outcomes (renewed, downgraded, churned) by segment/region.
- GRR and NRR trends (quarterly).
- Churn by reason and segment.
These dashboards are for internal use, but structured to match board narratives.
Step 6 – Add Funnel and Efficiency Views to Explain the “Why”
Boards don’t just want “what happened”. They want why.
Add:
- Lead → MQL → SQL/Opportunity → Customer funnel with conversion rates.
- Pipeline and revenue by source/channel.
- Basic CAC/efficiency proxies if you track spend or effort.
Questions you can now support:
- Are we adding enough pipeline by segment/region?
- Are we improving conversion rates?
- Which channels are working at acceptable unit economics?
HubSpot is where this funnel detail lives—even if you only show the highlights in board decks.
Step 7 – Implement a Quarterly “Board Prep” Checklist for HubSpot
Avoid last-minute data scrambles by standardising prep.
Before each board meeting:
RevOps runs checks:
- No large deals in past-due stages.
- Deal type, Segment, Region filled for all Closed Won and key pipeline.
- Renewal/expansion deals correctly typed.
- Health of attribution fields if you plan to discuss marketing impact.
Finance & RevOps reconcile:
- Closed Won vs booked revenue for the period.
- Any timing/FX adjustments explained.
Codify this as a short SOP:
- “Two weeks before board: run these dashboards, fix these gaps.”
Step 8 – Use HubSpot as the “Drill-Down Engine” Behind the Deck
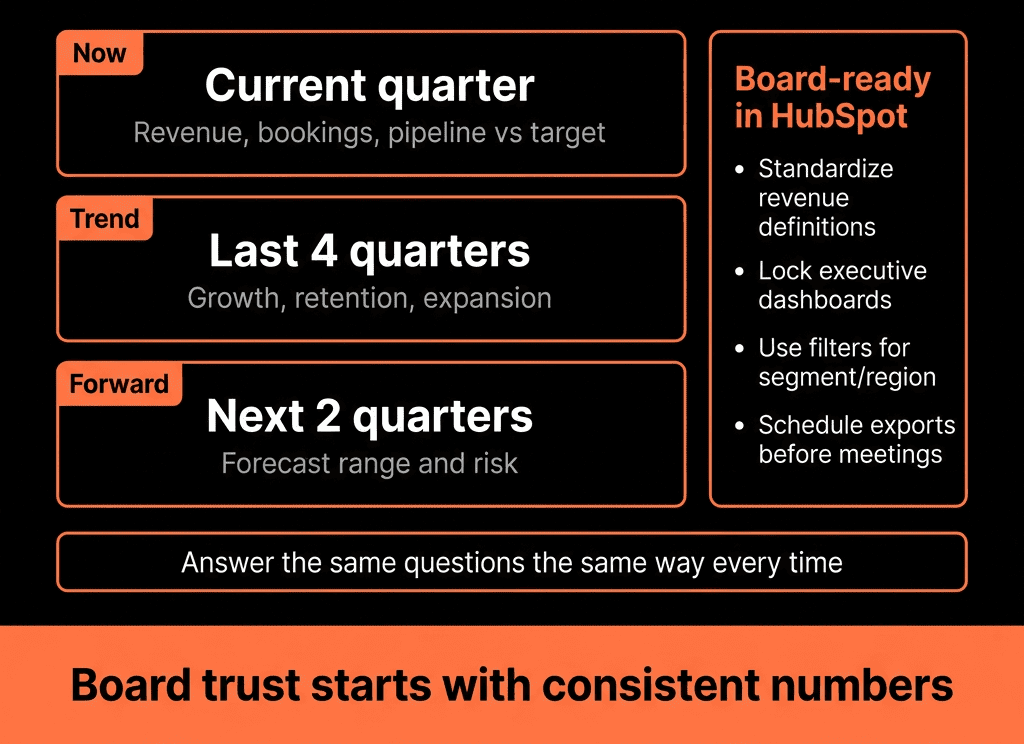
The board sees slides.
Execs need a way to answer follow-up questions live.
During internal prep:
Use HubSpot dashboards to:
- Drill from “New business down 10% in EMEA” → which segments/industries?
- From “Churn up in SMB” → which cohorts and reasons?
Refine your slides using these insights, but keep HubSpot as:
- The place you verify claims.
- The source when investors ask for more detail post-meeting.
Over time, you’ll need fewer custom spreadsheets because HubSpot already holds the structure.
Step 9 – Keep the Board Model and HubSpot Model in Sync Over Time
As you change:
- ICP.
- Territory design.
- Product/pricing.
- Segmentation.
RevOps should:
- Update HubSpot properties and workflows accordingly.
- Make sure new segments/regions/products are reflected both:
- In board reporting templates.
- In HubSpot reporting and filters.
At least quarterly:
- Review whether current dashboards still match board-level framing.
- Prune old fields and views that no longer map to how you talk about the business.
Step 10 – Phase In, Don’t Big-Bang
If you’re far from board-ready HubSpot reporting today:
Phase 1 (1–2 quarters):
- Get clean Deal type and basic segment/region tagging.
- Stabilise pipelines and stages.
- Build New/Renewal/Expansion revenue and pipeline dashboards.
Phase 2:
- Add retention/NRR and basic churn reasons.
- Add pipeline coverage and forecast-quality views.
Phase 3:
- Integrate finance metrics where needed.
- Add cohort, efficiency, and segment-level insights.
The board doesn’t need perfection immediately.
They need directionally right, consistent, and improving data.
Want Help Making HubSpot a Trusted Input to Your Board Packs?
If you’re still rebuilding everything in Excel before every investor or board meeting, we can help move more of that work into HubSpot.
Through our HubSpot Implementation Blueprints, Portal Health Check, and Managed RevOps Retainer, we:
- Align your HubSpot data model with how you report revenue to the board.
- Clean and standardise key fields for bookings, segments, and regions.
- Build a compact board-aligned dashboard pack for internal prep.
- Help you reconcile HubSpot with finance and codify a repeatable quarterly process.
So your board conversations are based on one consistent revenue story—and HubSpot becomes an asset, not an afterthought.