

Bad Data Isn’t Just Annoying. It’s Expensive.
Most teams know their HubSpot data isn’t perfect.
They say things like:
- “We have some duplicates, but it’s fine.”
- “Lifecycle isn’t used consistently.”
- “Our reports are close enough.”
What they don’t see is the real financial cost of that bad data:
- Time wasted by Sales, Marketing, and CS.
- Revenue lost from misrouted or ignored leads.
- Forecast and strategy decisions made on shaky numbers.
- Extra tools and manual work to “patch” data issues.
In this article, we’ll walk through:
- How to quantify the cost of bad data in HubSpot using simple assumptions.
- How to build a practical plan to fix it—without boiling the ocean.
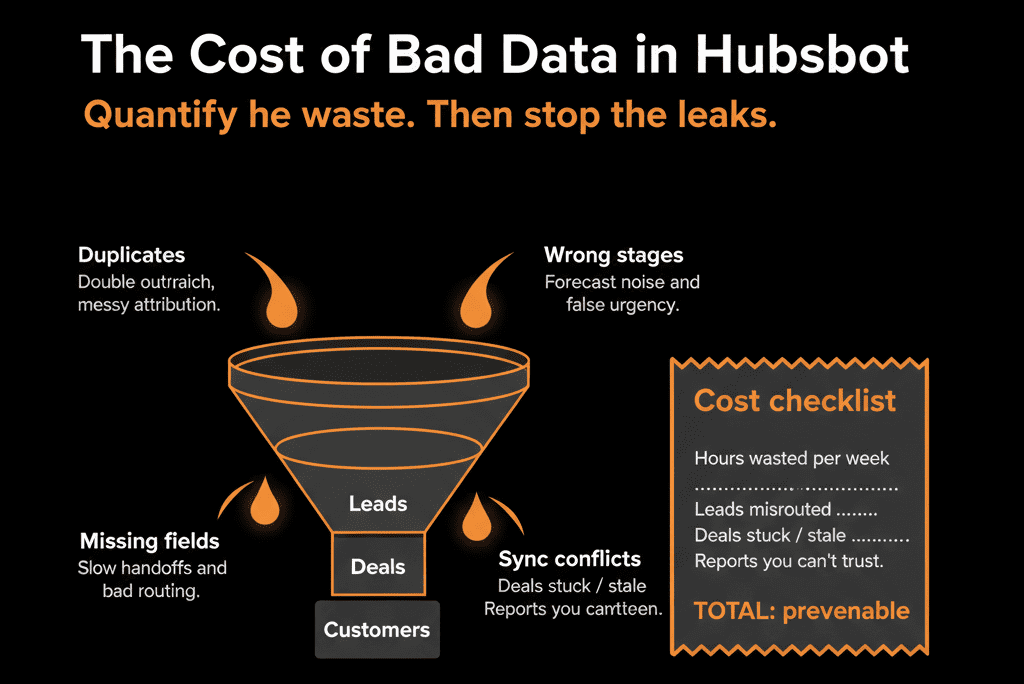
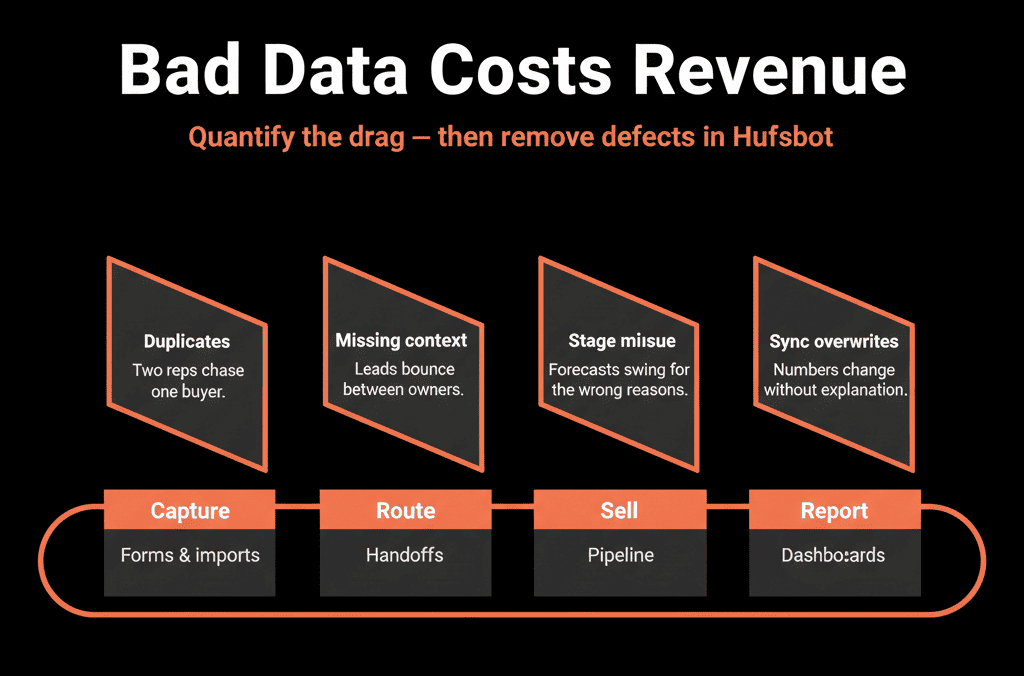
Part 1 – How Bad Data Shows Up in Day‑to‑Day Work
Bad data usually isn’t obvious at first glance. It sneaks in through:
Duplicates
- Multiple records for the same person or account.
- Activity and deals split across records.
Missing key fields
- No owner, country, lifecycle, or industry.
- Records that can’t be routed, segmented, or reported on properly.
Inconsistent values
- Country spelled 10 different ways.
- Industry as free‑text with dozens of variations.
Broken lifecycles and stages
- Customers marked as Leads.
- Deals stuck in “Open” or bad stages.
Polluted data from integrations
- External tools overwriting owner, lifecycle, or segment fields.
Each of these has a cost—time, opportunity, or risk.
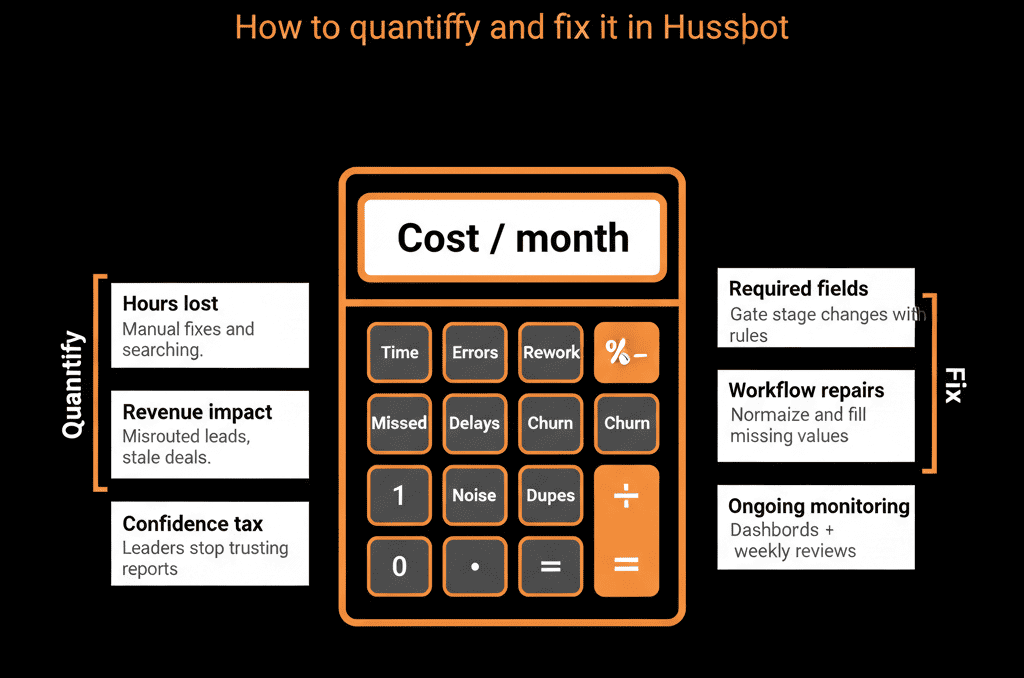
Part 2 – Quantify the Cost: A Simple Model
You don’t need perfect precision. You need a credible order‑of‑magnitude view.
Below is a way to estimate annual impact using your own numbers.
1) Time Waste Across Revenue Teams
Bad data creates friction:
- Reps hunt for the right record.
- Marketers manually fix lists.
- RevOps manually cleans and reconciles reports.
Example: Sales time waste
Team: 10 reps.
Each rep loses 15 minutes/day dealing with duplicates, missing fields, and bad views.
Calculation:
15 min × 10 reps × 5 days = 750 minutes/week.
750 / 60 ≈ 12.5 hours/week.
≈ 50 hours/month.
If fully loaded cost per rep ~ $60/hour:
50 × $60 = $3,000/month.
≈ $36,000/year.
Add Marketing/Ops:
Extra 15 hours/month fixing lists, segments, and dashboards.
15 × $60 ≈ $900/month → ~$10,800/year.
Conservative subtotal: ~$45,000/year in reclaimed productivity.
2) Lost Pipeline from Misrouted or Ignored Leads
Bad data affects lead routing and follow‑up:
- Leads without owners.
- Leads with missing/lazy fields never enter key workflows.
- Duplicates lead to confusion or double‑contact.
Example: Speed‑to‑lead impact
100 high‑intent leads/month (demos, trials, contact sales).
With clean routing: 90% get contacted within 24 hours.
With broken routing/data: Only 60% get timely contact; the rest get delayed or ignored.
Assume:
Contacted within 24 hours → 30% become opportunities.
Contacted late/never → 10% become opportunities.
Clean scenario:
90 leads × 30% = 27 opps.
10 leads × 10% = 1 opp.
Total: 28 opps/month.
Dirty data scenario:
60 leads × 30% = 18 opps.
40 leads × 10% = 4 opps.
Total: 22 opps/month.
Difference: 6 opps/month.
If avg opp = $10,000 pipeline: 6 × $10,000 = $60,000 extra pipeline/month.
At 25% win rate: $15,000/month in won revenue.
≈ $180,000/year.
Even if only half of that is attributable to bad data/routing, that’s ~$90,000/year.
3) Forecast and Reporting Inaccuracy
When deals and lifecycles are wrong:
- Forecasts don’t match reality.
- Leadership makes decisions (hiring, spend) on bad numbers.
Example: Forecast variance
Suppose your quarterly target is $1M.
If bad data keeps you off by 10–15% in forecast vs actual:
$100k–$150k variance per quarter.
Not all of that is data’s fault.
But if you conservatively attribute 20–30% to poor pipeline hygiene and bad data:
$100k variance × 25% ≈ $25,000 “data‑related” variance/quarter.
≈ $100,000/year in misinformed decisions.
This shows leadership that bad HubSpot data is a strategy problem, not just an Ops annoyance.
4) Extra Tools and Workarounds
When HubSpot data can’t be trusted, organizations:
- Buy extra tools for basic tasks (reporting, lists, outreach).
- Export to spreadsheets and BI just to get clean numbers.
Example:
Additional tools overlapping HubSpot’s capabilities:
- Email/automation tool: $800/month.
- Sales engagement tool: $600/month.
- Basic reporting add‑on or BI license: $400/month.
Total: ~$1,800/month → ~$21,600/year.
If half of that is only needed because HubSpot data isn’t reliable:
~$10,000/year in avoidable spend.
Add Ops/freelancer/consultant hours:
10 external hours/month at $150/hr cleaning reports and lists.
10 × $150 = $1,500/month → $18,000/year.
Rough subtotal: $25,000–$30,000/year in avoidable “patch” costs.
5) Risk and Compliance
Bad data makes:
- Suppression lists and consent states unreliable.
- Access and visibility harder to manage.
It’s harder to put a dollar figure here, but you can frame:
- Potential fines or customer trust issues due to mis‑handled data.
- The cost of a serious data issue (even once) far exceeding clean‑up investment.
Part 3 – Put It Together: A Simple Annual Cost Estimate
Add the conservative estimates:
- Time waste: ≈ $45,000/year.
- Lost pipeline / revenue: ≈ $90,000/year (very conservative vs examples).
- Forecast/reporting variance: ≈ $100,000/year (impact on decisions and performance).
- Tools and workarounds: ≈ $25,000/year.
Even with cautious assumptions:
Total = $260,000/year+ in impact from bad HubSpot data.
You can tailor each number with your own:
- Team sizes and rates.
- Lead and opp volumes.
- Tool and contractor spend.
Part 4 – How to Fix It Without a Massive “Data Project”
You don’t need a 12‑month data initiative. You need a focused, staged plan.
Step 1 – Run a Data Health Check Inside HubSpot
Audit:
- Duplicates: Contacts and Companies by email/domain.
- Missing key fields: Owner, lifecycle, country, industry, close date, amount.
- Inconsistent lifecycles and stages: Customers without closed‑won deals; deals stuck or with impossible stage progressions.
- Integration behavior: Which integrations are creating or overwriting data.
Outcome: a prioritized list of issues and their business impact.
Step 2 – Prioritize Fixes by Revenue and Routing Impact
Not all issues are equal. Focus on:
- Fields that drive routing and ownership: Owner, territory/region, lead source.
- Fields that drive reporting and forecasting: Deal stage, amount, close date, lifecycle.
- Fields that drive segmentation and targeting: Country, industry, ICP tier, product interest.
Sequence your fixes:
- Tier 1: immediate routing, forecasting, segmentation impact.
- Tier 2: additional clean‑up for nicer‑to‑have reporting.
Step 3 – Clean Existing Data in Batches
Use a mix of:
- Lists and filters to find records missing or holding bad values.
- Bulk edits to update obvious groups (e.g., country variants).
- Workflows to normalize values (US/USA → United States) and sync fields across objects.
- Deduplication tools (native or third‑party) to merge obvious duplicates.
Do this in controlled batches, starting with highest‑impact segments (e.g., current pipeline, active customers, high‑intent leads).
Step 4 – Add Guardrails So Data Stays Clean
Prevent regression by:
- Tightening property types: Use dropdowns instead of free‑text for core fields.
- Stage‑based required fields: Enforce key data at critical deal/ticket stages.
- Validation workflows: Flag and correct suspicious changes (e.g., lifecycle regression, missing close dates).
- Integration rules: Limit which external systems can overwrite key HubSpot properties.
This shifts you from “one big clean‑up” to continuous protection.
Step 5 – Make Data Health Visible with Dashboards
Build simple dashboards to track:
- % of records with owners, lifecycle, country, industry.
- % of deals with amount and close date.
- Duplicates and orphan records.
Review monthly in RevOps/leadership meetings.
Use trends to show improvement over time—and where to focus next.
Pulling It Together: Turn a Hidden Cost into a Visible, Fixable Problem
Bad data in HubSpot is not just an Ops headache.
It quietly erodes:
- Productivity.
- Pipeline and revenue.
- Decision quality.
- Tech stack efficiency.
By quantifying even conservatively, you can often show:
$100k–$300k+ in annual impact.
That’s more than enough to justify:
- A structured Health Check.
- Focused clean‑up and governance.
- The right implementation or RevOps partner.
Want Help Quantifying and Fixing the Cost of Bad Data in Your HubSpot Portal?
If you know bad data is hurting you—but need a clear picture and a fix plan—this is exactly where we can help.
Our HubSpot Portal Health Check and Migration & ROI Plan are designed to:
- Audit your current data quality and its business impact.
- Build a simple cost model tailored to your funnel and team.
- Deliver a prioritized roadmap of clean‑up, validation, and governance steps.