

HubSpot Should Tell You How to Win More, Not Just What You’ve Logged
Most teams use HubSpot to:
- Log deals.
- Move stages.
- Forecast roughly.
That’s “CRM as a database”.
It doesn’t change outcomes.
To improve win rates, HubSpot must:
- Capture the right signals in each stage.
- Expose risk early.
- Guide reps on what to do next.
- Feed managers with coaching insights, not just totals.
Below is how we design HubSpot so it actively pushes win rates up.
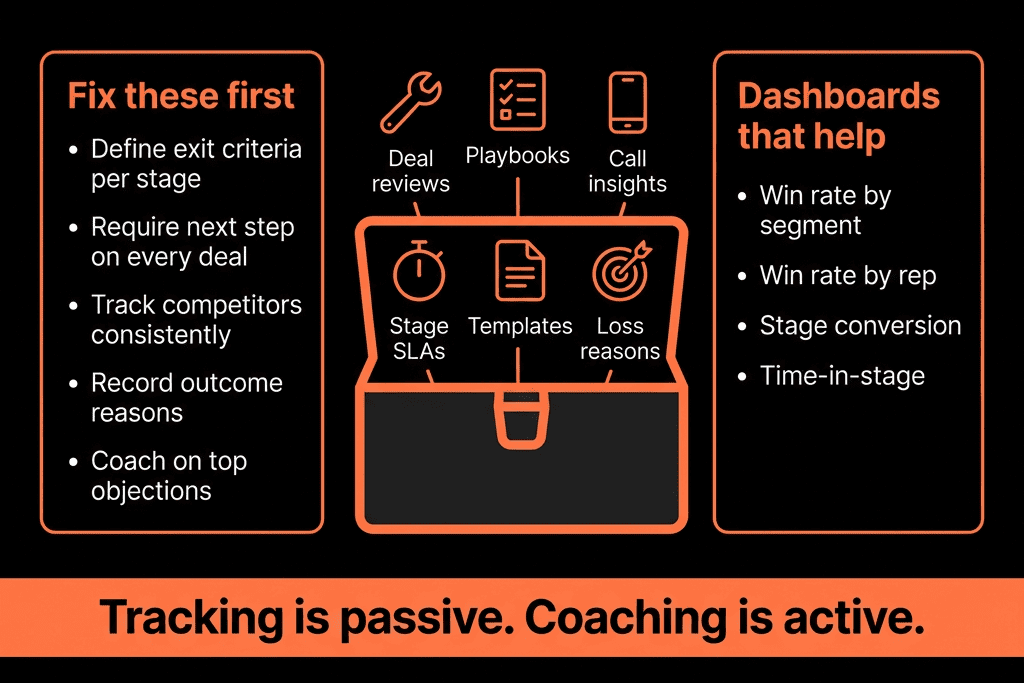
Step 1 – Redesign Deal Stages Around Customer Decisions, Not Internal Milestones
If your stages are “Discovery → Demo → Proposal → Negotiation → Closed”, they’re about you.
Win-rate impact comes from stages that mirror customer commitment.
Examples:
- Qualified – clear pain, budget, and timeline.
- Problem Agreed – mutual understanding of problem and impact.
- Solution Fit Confirmed – champion believes your approach solves it.
- Decision Process Mapped – stakeholders, steps, and dates known.
- Business Case Approved – value is clear, economic buyer bought in.
- Verbal Commit – commercial terms accepted.
- Closed Won / Lost.
For each stage, define:
- Entry criteria – what must be true.
- Exit criteria – what must be done or confirmed.
- Required fields – what HubSpot must capture there.
Now your pipeline shows where deals really are, not just meeting count.
Step 2 – Add Deal Properties That Predict Wins (and Losses)
We then add a small set of properties that correlate with win rates.
Examples:
- Primary pain / use case (Dropdown).
- Decision maker identified (Yes/No).
- Champion identified (Yes/No).
- Number of stakeholders (Number).
- Competitive situation (Dropdown: Greenfield / Replacing vendor / Competitive bake-off).
- Sales methodology status (MEDDIC/BANT fields if you use them).
- Deal risk level (Low/Medium/High).
- Next step (Text).
- Next step date (Date).
We configure:
- Stage-based required fields: Example: You can’t move to Decision Process Mapped without Number of stakeholders and Decision maker identified filled.
- Validation where possible (dropdowns, radios, checkboxes) to avoid messy text.
Over time, these fields become your win-rate dataset.
Step 3 – Turn HubSpot Into a “Next Best Action” Engine for Reps
To move from tracking to improving, HubSpot must tell reps what to do next.
We use deal-based workflows to:
Nudge on missing critical fields
Trigger: Deal moves into a key stage AND critical fields are blank.
Action:
Internal notification to owner:
“You’ve moved to [Stage], but [fields] are missing. Update before next call.”
Optionally, create a task: “Complete qualification fields for [Deal].”
Enforce Next step discipline
Trigger: Deal in mid-late stage AND Next step date is in the past.
Action:
Create task: “Set and log new next step for [Deal].”
Notify manager if pattern repeats.
Automate follow-ups at key risk moments
Trigger: No activity on deal for X days, by stage.
Action:
Task for owner: “Re-engage [Deal] – no activity in [X] days.”
Optionally, enroll contact in a light-touch follow-up sequence (if your process allows).
This shifts HubSpot from passive storage to proactive sales assistant.
Step 4 – Use Playbooks to Drive Better Discovery and Qualification
Win rate is largely decided in early conversations.
If reps wing discovery, variance explodes.
We use HubSpot Playbooks to standardize:
- Discovery calls.
- Technical validation.
- Pricing/ROI discussions.
Each Playbook:
- Lists questions tied directly to your deal properties.
- Writes key answers into structured fields (pain, impact, decision criteria, etc.).
- Optionally changes stage when key conditions are met.
This gives:
- Reps: a repeatable conversation framework.
- Managers: consistent data across deals for coaching.
- Leadership: clearer view of true qualification quality, not just volume.
Step 5 – Implement Win/Loss Reasons That Are Actually Useable
“Price”, “Timing”, “Competition” as free-text isn’t enough.
We want structured, insightful loss data.
Configure:
- Closed won reason (Dropdown + optional text).
- Closed lost reason (Dropdown: No decision / Lost to competitor / Lost to status quo / Budget / Timing / Product gap / Bad fit, etc.).
- Closed lost competitor (Dropdown).
- Closed lost primary cause (self-assessed) (Dropdown: Positioning / Process / Product / Pricing / Execution).
Use:
- Required fields on Closed Won/Lost to force completion.
- A brief Playbook for win/loss debrief to capture context without slowing reps down.
Over months, this becomes your win-rate improvement map:
- Where to adjust positioning.
- Where to narrow ICP.
- Where to fix process.
Step 6 – Build Manager Dashboards Focused on Win Levers, Not Just Volume
Now we design dashboards that show why you win or lose.
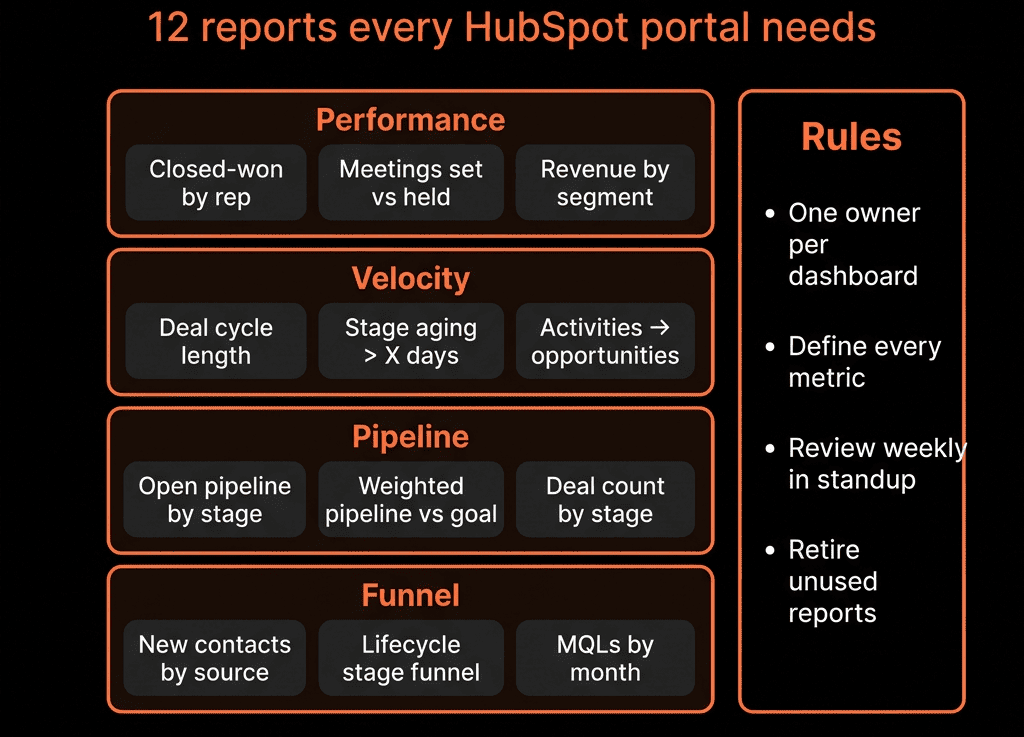
Key reports:
Win rate by stage entered
Show % won for deals that reached each stage.
Spot stages where deals stall and die.
Win rate by segment
Industry, company size, region, product line.
Decide where to focus go-to-market.
Win rate by rep vs key behavior indicators
Win rate vs % of deals with:
- Decision maker identified = Yes.
- Champion identified = Yes.
- Completed discovery Playbook.
Shows which behaviors correlate with winning.
Loss reasons analysis
Deals Lost amount by Closed lost reason.
Trend by quarter.
Pipeline hygiene and risk
- Deals with overdue Next step date.
- Deals with no activity in X days, by stage.
- Aging by stage.
Managers then coach on inputs (discovery quality, stakeholder mapping, next steps) rather than just chasing bigger top-of-funnel.
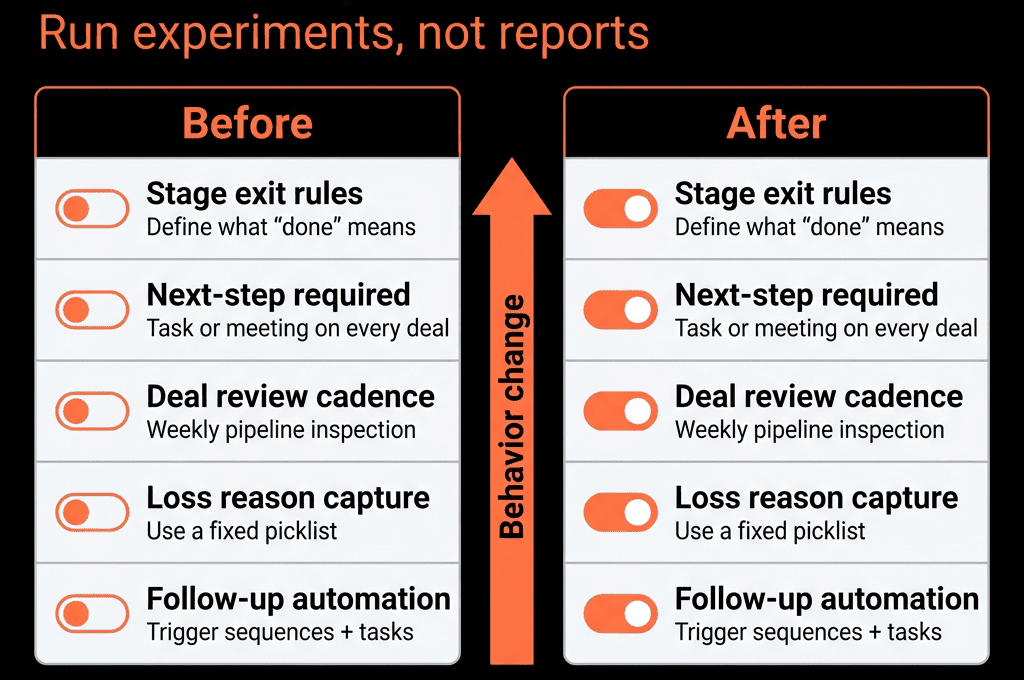
Step 7 – Use Cohort Analysis to See If Changes Actually Improve Win Rates
When you change process, you need to prove it worked.
Set up simple cohort views:
Filter deals by Create date in periods (e.g., pre- and post-playbook rollout).
Compare:
- Overall win rate.
- Stage-by-stage conversion.
- Average sales cycle length.
- Average discount or deal size.
Example:
Before: 22% win rate, 68-day cycle.
After enforcing Decision process mapped stage criteria and Playbook:
27% win rate, 60-day cycle.
This is how you prove to leadership that changes inside HubSpot moved actual outcomes, not just data hygiene.
Step 8 – Align Forecasting With Reality, Not Optimism
Forecast accuracy impacts win rate because it influences behavior:
- Overconfident: no urgency, weak deal reviews.
- Underconfident: constant discounting and panic.
Use HubSpot to:
Add a Forecast category property
Pipeline / Best case / Commit / Omitted.
Train reps and managers on definitions.
Compare forecast vs actual
Reports by rep and segment.
Spot who sandbags vs who overcommits.
Use Deal review views that show:
- Stage.
- Forecast category.
- Key fields (decision maker, champion, stakeholders, next step).
- Last activity date.
Deal reviews become coaching sessions on deal health, not just “What’s closing this month?”.
Better inspections → clearer plans → higher win rates.
Step 9 – Close the Loop With Marketing and CS
To sustainably improve win rates, sales can’t operate in isolation.
Use HubSpot to share:
- High-win ICP definition back to marketing: Industries, problems, and triggers with the highest close rates.
- Loss reasons and competitor intel back to marketing for positioning and content.
- Implementation/CS feedback for renewal and expansion: Which deals are hardest to onboard? Which use cases churn faster?
Set up:
- Shared reports and dashboards across Hubs.
- A simple monthly RevOps review where these insights are discussed and actions agreed.
HubSpot becomes the single source of truth for the full revenue cycle.
Turning HubSpot Into a Win-Rate Machine
To move beyond “deal tracker”, we architect HubSpot so that it:
- Has stages and fields that reflect real buying decisions.
- Captures the signals that predict wins and losses.
- Guides reps through next best actions and consistent discovery.
- Feeds managers with the right coaching insights.
- Lets leadership see where process changes improve win rates over time.
The technology is already there.
What’s usually missing is the architecture and discipline.
Want Help Designing HubSpot Around Win Rates, Not Just Pipe Hygiene?
If your HubSpot deals “look busy” but win rates are flat, we can help.
Through our HubSpot Portal Health Check and Migration & ROI Plan, we:
- Audit your current deal stages, properties, and sales workflows.
- Redesign your pipeline and data model around win-rate drivers.
- Implement Playbooks, workflows, and dashboards that guide reps and managers.
- Build before/after reporting so you can measure win-rate improvement clearly.
- Make sure dont miss any word.