

Executives Don’t Need More Data – They Need a Clear Layer
Most HubSpot portals have two extremes:
- Dashboards built “bottom up” from random reports.
- Or dozens of views that only operations people understand.
Executives end up asking for:
- Screenshots.
- Spreadsheet exports.
- Custom slide decks every month.
The fix is not “more dashboards.”
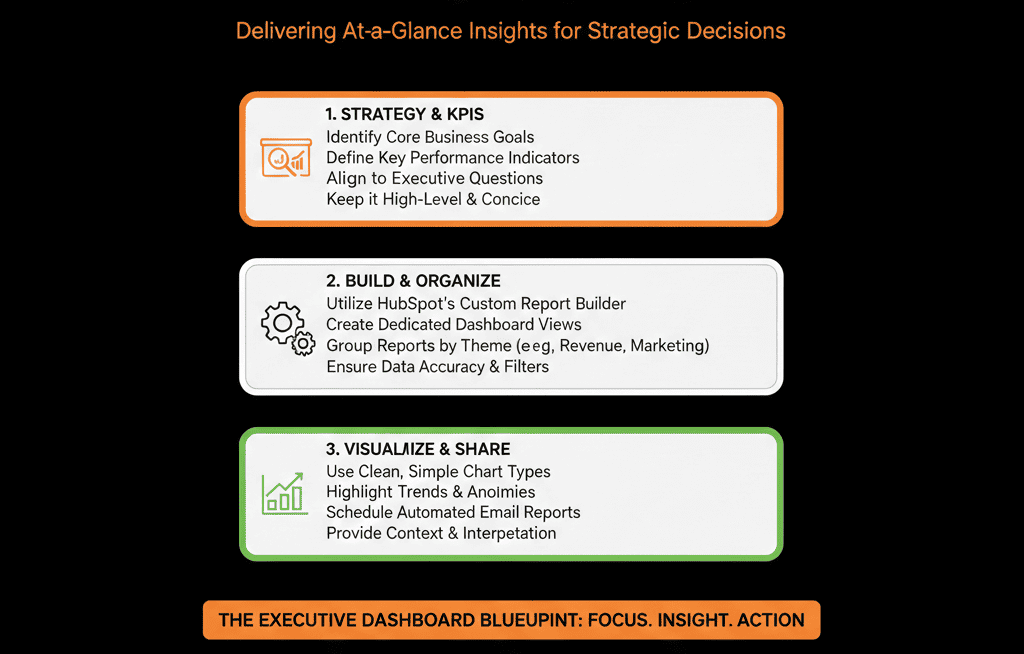
It’s a deliberate Executive Dashboard Layer:
- A small set of carefully designed dashboards.
- Fed by stable architecture and definitions.
- Owned and explained by RevOps / leadership.
This article explains how we design that executive layer in HubSpot reporting.
Step 1 – Decide Which Questions Executives Must Answer in 30 Seconds
We start by ignoring HubSpot for a moment and asking leadership:
“In 30 seconds, what do you need to know?”
The list is usually some version of:
- Are we on track to hit revenue targets?
- Do we have enough pipeline, and is it in the right stages?
- How is the funnel performing (Lead → Opportunity → Customer)?
- Which segments/sources are driving growth?
- Where are the biggest risks or leaks?
Those become the top-level questions your Executive Dashboard Layer must answer.
We limit this to 5–8 core questions to avoid bloat.
Step 2 – Define the Executive Dashboard Layer Structure
We design the layer as a small stack of dashboards, typically:
- Executive Revenue & Pipeline
- Executive Funnel & Conversion
- Executive Source & Segment Performance
- Executive Customer & Retention (if CS data lives in HubSpot)
Each dashboard:
- Has a clear purpose (“Revenue & Pipeline – Source of Truth”).
- Is designed for leadership, not for front-line users.
- Is fed by consistent definitions you can explain in one meeting.
RevOps and operations may maintain more detailed dashboards—but executives primarily live in these.
Step 3 – Establish Reporting Definitions Before Building Reports
Executive dashboards break when:
- “Revenue” means different things to different people.
- “Opportunity” is used inconsistently.
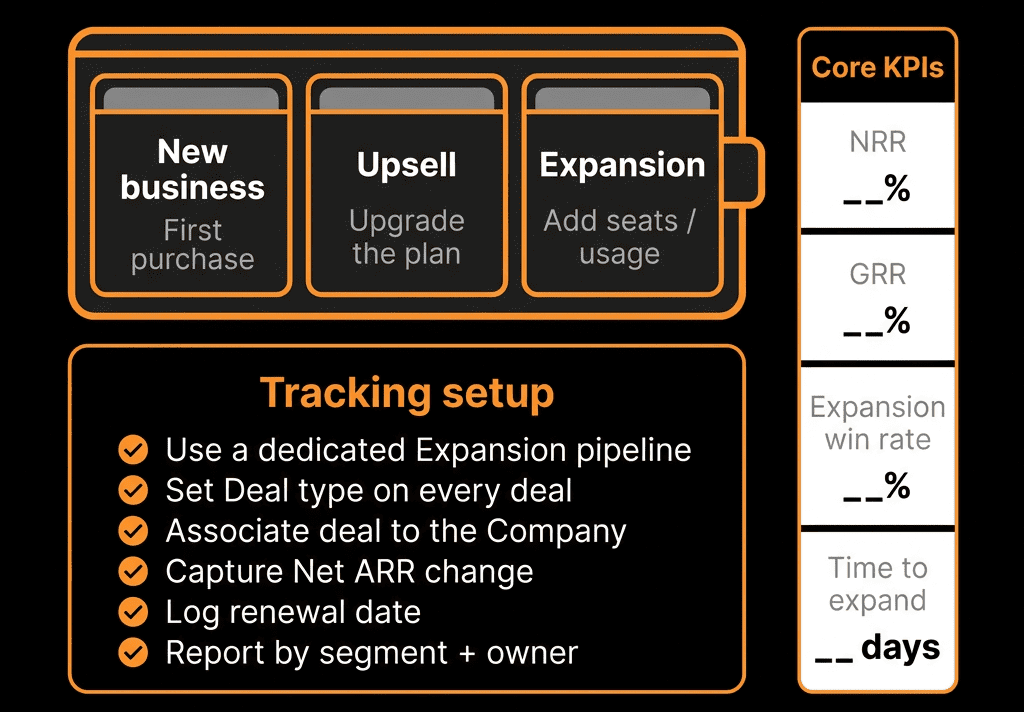
- “New business vs expansion” is not clearly split.
Before we drag any widgets in HubSpot, we document:
- What counts as New business revenue (e.g., first-time closed-won deals by company).
- What counts as Expansion/renewal revenue (e.g., renewals, upsells in a separate pipeline or flagged deals).
- What is an Opportunity (often tied to specific deal stages or lifecycle).
- What is our ICP / segment model (e.g., ICP A/B/C, SMB/MM/Enterprise).
- How we define sources (normalized lead source).
These definitions drive:
- Report filters.
- Pipeline selection.
- Segmentation and breakdowns.
We make sure this is written down and agreed on before building the executive layer.
Step 4 – Build the Executive Revenue & Pipeline Dashboard
This is usually Dashboard #1 for executives.
Key components:
1. Revenue vs target
Closed-won revenue vs goal, by month/quarter.
Optional split by:
- New vs expansion.
- Region or segment.
This answers:
Are we hitting the number?
2. Forecast vs target (if forecasting is set up)
Forecast amount vs target, by period.
Commit / Best case / Pipeline view if using forecast categories.
This answers:
Are we going to hit the number?
3. Pipeline coverage
Open pipeline by stage for current and next period.
Pipeline coverage ratio (pipeline amount / quota) per team/region.
This answers:
Do we have enough pipeline to hit future numbers?
4. Top deals and concentration
Top X open deals by amount and stage.
Optional report showing % of pipeline concentrated in top 10 or 20 deals.
This answers:
How much risk do we have in a few big bets?
Step 5 – Build the Executive Funnel & Conversion Dashboard
Dashboard #2 focuses on how efficiently we move from Lead → Customer.
Key components:
1. Lifecycle funnel
Lead → MQL → SQL → Opportunity → Customer.
Volume and conversion rates over a defined period.
This shows:
Are we generating enough at each stage?
Where is the main drop-off?
2. Stage conversion and velocity
Deal stage-to-stage conversion.
Average time spent in each stage.
This helps executives see:
Which parts of the sales process are slow or leaky.
Whether process changes or enablement are needed.
3. Key funnel KPI trends
MQLs, SQLs, Opportunities, Customers per month.
Trend lines over the last 6–12 months.
This answers:
Is our funnel growing, shrinking, or flat?
Step 6 – Build the Executive Source & Segment Performance Dashboard
Dashboard #3 connects results to strategy.
Key components:
1. Pipeline and revenue by normalized lead source
Use your normalized Lead source field.
Show pipeline and closed-won revenue per source (Paid Search, Organic, Referral, Outbound, Event, etc.).
This answers:
Where are we truly winning?
Which channels deserve more or less investment?
2. Pipeline and revenue by segment/ICP
Cut data by segment (e.g., ICP A/B/C, SMB/MM/Enterprise, key industries).
This answers:
Are we winning in our ideal customers or drifting into low-fit accounts?
Are strategic bet segments pulling their weight?
3. High-level CAC/ROI views (if you track spend)
High-level cost vs revenue by channel.
At least directional insight (e.g., Paid vs Organic vs Partner).
Executives can then connect spend → pipeline → revenue at a strategic level.
Step 7 – Build an Executive Customer & Retention Dashboard (If Applicable)
If CS and renewals live in HubSpot, Dashboard #4 focuses on customer health.
Key components:
- Renewal pipeline and forecast.
- Churn vs expansion revenue.
- Retention by segment / product / region.
- Basic health indicators (tickets, NPS, CSAT, engagement).
This helps leadership see:
- How much of next quarter’s revenue is in renewals vs new business.
- Where churn risk is concentrated.
- Which customers represent the strongest expansion opportunities.
If CS data is not in HubSpot, we either:
- Integrate what’s needed.
- Or keep this dashboard minimal and focus on what HubSpot can reliably show.
Step 8 – Put Governance Around the Executive Layer
The executive dashboard layer needs to be:
- Stable: not changing every week.
- Owned: someone is accountable for accuracy.
- Documented: definitions and filters are clear.
We recommend:
- Assigning a RevOps / HubSpot Architect as the owner of the executive dashboards.
Documenting each report with:
- What it shows.
- How it’s filtered.
- Which definitions it uses.
Reviewing the executive dashboards monthly or quarterly with leadership:
- Are these still the right questions?
- Is anything unclear or misleading?
- Do we need to refine architecture or data to support better answers?
We strongly discourage:
- Letting anyone freely edit the executive dashboards.
- Creating ad-hoc variations for every small request—those belong in separate working dashboards, not in the executive layer.
Step 9 – Use the Executive Layer Live in Leadership Meetings
The real test of your executive dashboard layer:
Can you run a leadership or board-prep meeting directly from HubSpot without exporting everything?
We encourage:
- Opening the executive dashboards live in meetings.
- Drilling into underlying reports as needed.
- Flagging any discrepancies between what’s in HubSpot and what finance or external tools show.
Every discrepancy either:
- Surfaces a data or process issue to fix in HubSpot, or
- Reveals a definition mismatch to resolve between teams.
Over time, this builds trust:
Leadership sees that HubSpot is not just a marketing tool—it’s their revenue command center.
What You Can Do in the Next 30 Days
If executives currently avoid HubSpot dashboards:
- Schedule a 30–60 minute session with your leadership to list 5–8 top questions they need answered.
- Create 1 new dashboard called “Executive – Revenue & Pipeline (Source of Truth)”.
- Add a minimal set of reports aligned to those questions.
Present it in the next leadership meeting and collect feedback:
- What was useful?
- What was confusing?
- What’s missing?
Use that feedback to refine the architecture and definitions underneath, not just the charts.
You don’t need perfection out of the gate.
You need a clear, owned starting point you can iterate from.
Want an Expert-Designed Executive Layer in Your HubSpot Reporting?
If your current HubSpot dashboards are noisy, inconsistent, or ignored by leadership, you likely have:
- Misaligned definitions.
- Weak architecture feeding the reports.
- No clear executive layer strategy.
As part of our HubSpot Portal Health Check / HubSpot Audit, we:
- Review your current data model, lifecycle, and reporting.
- Design a tailored Executive Dashboard Layer aligned to your business model, segments, and growth goals.
- Provide a clear plan to tighten up the underlying architecture so those dashboards stay accurate.