

Executives Don’t Need Every Report. They Need the Right Layer.
Most HubSpot portals have:
- Too many dashboards.
- Too many variations of the same metric.
- No clear agreement on which view is the “real” one.
Executives stop logging in because:
- It takes too long to find what matters.
- The numbers don’t line up with finance or their expectations.
- Every dashboard feels like a one-off.
The solution is not more dashboards.
It’s a deliberate Executive Dashboard Layer:
- A small, curated set of dashboards.
- Built on stable definitions and architecture.
- Designed for leadership questions, not power-user curiosity.
This article shows you how to build that layer in HubSpot.
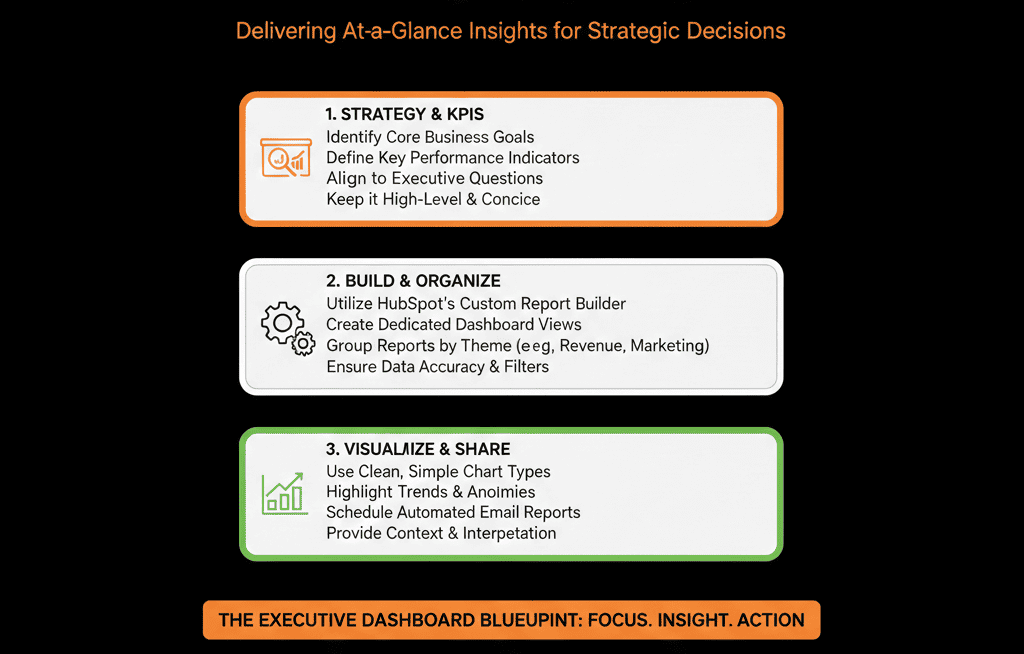
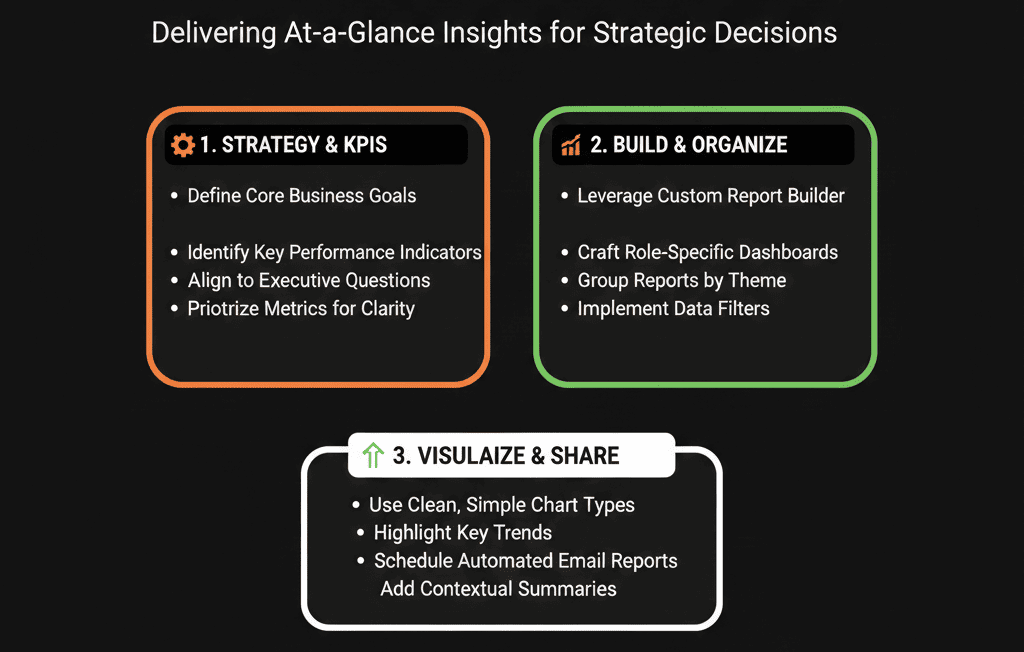
Step 1 – Capture the 6–8 Questions Leadership Really Cares About
Before touching HubSpot, ask your CEO/CRO/COO:
“If you could only see a handful of views in HubSpot every week, what would they be?”
Typical answers:
- Are we on track to hit our revenue target this quarter?
- Do we have enough pipeline, and is it healthy (by stage, segment, and rep)?
- How is our funnel performing from Lead → Opportunity → Customer?
- Which channels and campaigns actually drive opportunities and revenue?
- Are we winning in our target segments/ICP, or drifting off-IC?
- How are we doing on renewals and expansions vs new business?
- Where are the biggest risks or leaks in the process?
These become the design brief for your executive layer.
Step 2 – Fix the Minimum Architecture Needed Before Building Dashboards
Executive dashboards are only as good as the architecture underneath.
Before building, sanity-check:
Pipelines & stages
- Do you have a clearly defined primary new business pipeline?
- Are stages aligned to buyer milestones (not internal tasks)?
- Are renewals/expansions in a separate, clearly labeled pipeline or flagged?
Lifecycle & opportunity definition
Is there a consistent definition for:
- Lead
- MQL
- SQL
- Opportunity
- Customer
Is this reflected in lifecycle logic and deal creation behavior?
Lead source & segment fields
- Do you have a normalized lead source field?
- Do you have fields for segment/ICP/industry/region that are populated reliably?
You don’t need perfection, but you do need:
- A consistent way to separate new business vs expansion.
- A consistent way to represent funnel stages.
- A consistent way to slice by source and segment.
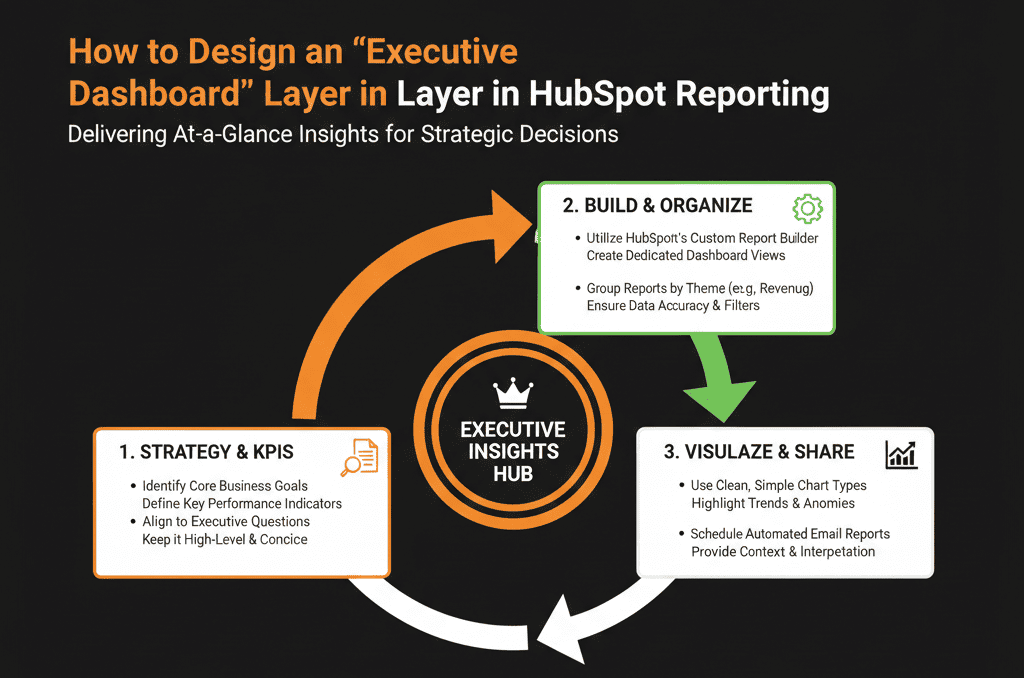
Step 3 – Design the Executive Dashboard Layer Structure
We recommend 3–4 dashboards for the executive layer:
- Executive – Revenue & Forecast
- Executive – Pipeline & Deal Health
- Executive – Funnel & Lead Flow
- Executive – Source & Segment Performance
Optionally, if CS is in HubSpot:
- Executive – Customers, Renewals & Expansion
Each dashboard:
- Has a clear owner (RevOps).
- Is labeled as a Source of Truth for its area.
- Uses consistent filters (pipelines, date ranges, teams).
- Has controlled access (limit who can view/edit executive dashboards).
Step 4 – Build Dashboard 1: Executive – Revenue & Forecast
Core components:
Closed-won revenue vs target (by period)
Show:
- Closed-won this quarter vs goal.
- Trend over past few quarters.
Split by:
- New business vs expansion (if possible).
Forecast vs target (current and next period)
If you use HubSpot’s forecast tool, map deal stages into forecast categories and roll up deals by category. [web:70]
If not:
Weighted pipeline vs target using stage probabilities.
Revenue by segment/region
Pipeline and closed-won broken down by:
- ICP tier / segment.
- Region or territory.
Questions this dashboard should answer:
- “Are we going to hit our number?”
- “Where is growth coming from?”
- “Are we over-exposed to one segment, region, or type of deal?”
Step 5 – Build Dashboard 2: Executive – Pipeline & Deal Health
Core components:
Open pipeline by stage and period
Show:
- Pipeline by stage for this quarter.
- Pipeline for next quarter.
Pipeline coverage
Pipeline vs target (x-times coverage) per:
- Team
- Region
- Segment
Top open deals
Top X deals by value, with:
- Stage
- Close date
- Owner
- Segment
Stalled deals
- Deals with no activity in the last X days, by stage or rep.
Questions this dashboard should answer:
- “Do we have enough pipeline for current and future quarters?”
- “Is the pipeline balanced across stages and segments?”
- “Which big bets do we need to keep an eye on?”
- “Where are deals getting stuck?”
Step 6 – Build Dashboard 3: Executive – Funnel & Lead Flow
Core components:
Lifecycle funnel
- Lead → MQL → SQL → Opportunity → Customer.
- Volume + conversion rates over a chosen period.
Deal funnel
- Stage-to-stage conversion in the sales pipeline.
- Average time in stage.
Lead and opportunity creation trends
- New leads/MQLs/SQLs and opportunities per week/month.
- Compared to previous periods.
Questions this dashboard should answer:
- “Is our funnel feeding enough qualified opportunities?”
- “Where are leads and deals dropping off?”
- “Are we speeding up or slowing down at key stages?”
Step 7 – Build Dashboard 4: Executive – Source & Segment Performance
Core components:
Pipeline and revenue by source
Using normalized lead source:
- Paid Search
- Paid Social
- Organic
- Direct/Brand
- Partner/Referral
- Outbound
- Event/Webinar, etc.
Pipeline and revenue by ICP/segment
By:
- ICP tier
- Industry
- Company size band
Basic ROI indicators (if cost data available)
- Cost per MQL/SQL/opportunity by source.
- High-level CAC or payback signals per channel.
Questions this dashboard should answer:
- “Which channels actually drive pipeline and revenue?”
- “Are we winning in our ICP segments?”
- “Where should we lean in or pull back?”
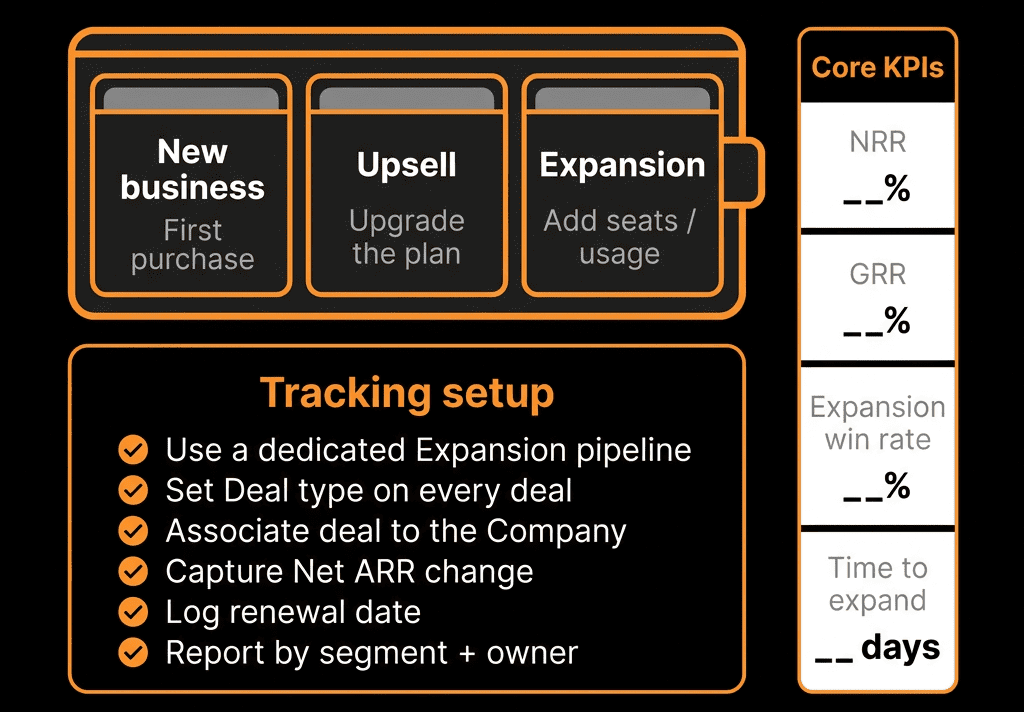
Step 8 – (Optional) Dashboard 5: Executive – Customers, Renewals & Expansion
If you track CS/renewals in HubSpot:
- Renewal pipeline and forecast.
- Churn vs expansion revenue.
- Customer count and revenue by segment.
- Basic health indicators (tickets, NPS/CSAT if present, product usage signals).
Questions this dashboard should answer:
- “How much of next quarter’s number comes from renewals vs new business?”
- “Where do we have churn risk?”
- “Which customer segments are expanding vs shrinking?”
Step 9 – Put Governance Around the Executive Layer
To keep the executive layer trustworthy:
Assign an owner (RevOps / HubSpot Architect):
Responsible for:
- Maintaining definitions and filters.
- Updating dashboards when architecture changes.
- Handling executive requests for tweaks.
Lock down editing rights:
- Limit who can change Executive dashboards. [web:13]
- Allow others to clone dashboards if they want variations. [web:60]
Document definitions:
- What counts as New business vs Expansion.
- What pipelines are included.
- Which date fields and filters are used.
Review regularly with leadership:
Monthly or quarterly:
- Confirm dashboards still answer the right questions.
- Identify data quality or process issues they expose.
- Adjust architecture as needed (not just visuals).
Step 10 – Run Leadership Meetings Directly From HubSpot
The final test of a successful executive layer:
Can you run your weekly forecast or monthly revenue review directly from these dashboards?
Practical steps:
- Use the Executive dashboards live in meetings.
- Drill into underlying deals, segments, or sources as needed.
- Capture data disagreements to fix (architecture or definition gaps).
- Capture new questions to support in future iterations.
This turns HubSpot from “that tool Marketing uses” into the shared revenue command center.
What You Can Do in the Next 30 Days
To start building an executive dashboard layer:
- Collect the top 6–8 questions your CEO/CRO wants answered weekly.
- Sanity-check main pipeline(s), lifecycle definitions, lead source and segment fields.
- Create one new dashboard: “Executive – Revenue & Pipeline (Source of Truth)”.
- Populate it with: Closed-won vs target, Forecast vs target, Pipeline by stage, Top deals.
- Use it in your next leadership meeting and gather feedback: What worked? What was confusing? What’s missing?
- Then expand to the other dashboards as architecture and data mature.
Want an Expert-Designed Executive Layer Built on Your HubSpot Portal?
If your leadership doesn’t trust or use HubSpot dashboards today, it’s usually because:
- The architecture underneath isn’t clear.
- Definitions don’t match finance or GTM reality.
- Dashboards weren’t designed for executives.
Our HubSpot Portal Health Check / HubSpot Audit can:
- Assess your current architecture and data readiness.
- Design a tailored Executive Dashboard Layer aligned to your targets, segments, and motions.
- Provide a clear plan to fix underlying issues so those dashboards stay accurate.