

You Don’t Need More Data. You Need the Right Views.
HubSpot can show you almost anything:
- Every email open.
- Every call logged.
- Every deal and ticket.
Without structure, you get:
- Dozens of ad‑hoc reports.
- Dashboards nobody opens.
- Leadership still asking Ops to “just export it to Excel.”
For CEOs and RevOps leaders, the goal is simple:
See the revenue engine clearly enough to steer it.
Below are 15 dashboards we consider “must‑have” in mature HubSpot RevOps setups—grouped by what they help you manage.
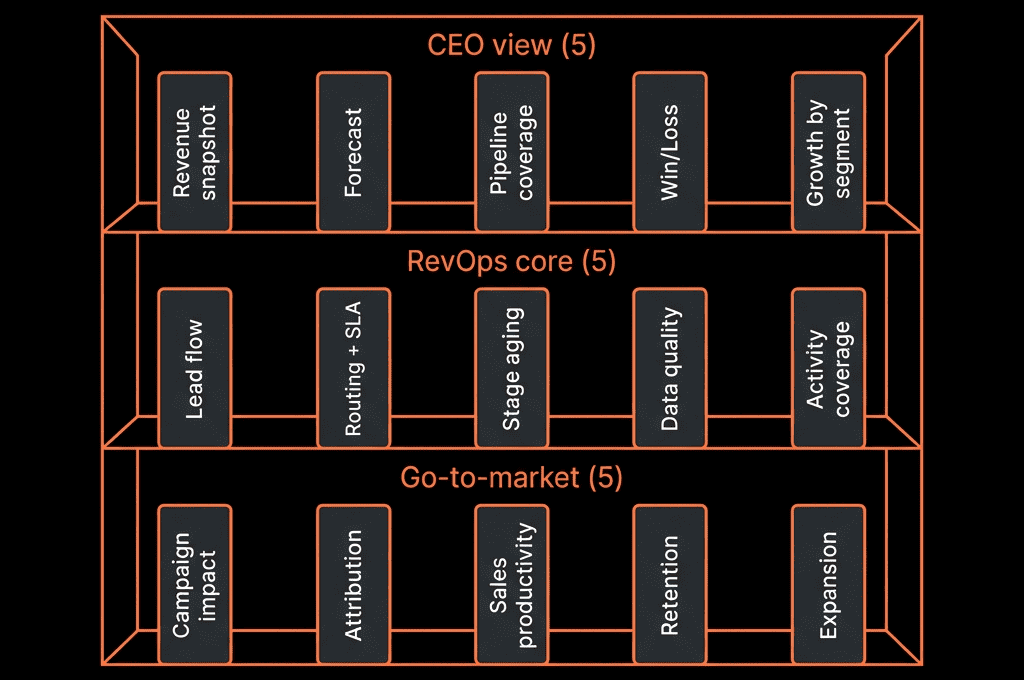
Cluster 1 – Executive & Revenue Overview
1) Executive Revenue Summary Dashboard
Purpose: High‑level GTM health for CEOs and execs.
Key widgets:
- New business revenue (Closed Won) by month/quarter, segmented (region/product/segment).
- Expansion vs churned revenue (NRR/GRR trend).
- Pipeline coverage (open pipeline vs target) for current and next quarter.
Why it matters: Quick read on whether top‑line and coverage are on track.
2) Pipeline Health & Forecast Dashboard
Purpose: Help leadership and RevOps trust, and act on, the forecast.
Key widgets:
- Pipeline by stage and expected close date (this and next quarter).
- Weighted pipeline value vs target.
- Win rates and average cycle time by stage/segment.
- “Aging” charts: deals stuck in stage > X days.
Why it matters: Shows if the forecast is built on healthy, progressing deals—or stalled ones.
Cluster 2 – Funnel and Demand
3) Full‑Funnel Conversion Dashboard
Purpose: Show how efficiently you convert from top‑of‑funnel to customers.
Key widgets:
- Volume and conversion rates: Lead → MQL → SQL → Opportunity → Customer.
- Funnel breakdown by segment (SMB/mid‑market/enterprise).
- Time spent in each lifecycle stage.
Why it matters: Identifies where to focus: generation, qualification, or closing.
4) Channel & Campaign Performance Dashboard
Purpose: Reveal which channels and campaigns produce actual revenue.
Key widgets:
- Leads, MQLs, Opportunities, and Customers by channel (paid search, organic, partner, events, outbound).
- Leads, MQLs, Opportunities, and Customers by campaign or campaign group.
- Cost per Opp / Cost per Customer (if cost data is integrated).
Why it matters: Lets you reallocate budget from “busy” channels to truly effective ones.
Cluster 3 – Expansion, Retention, and CS
5) Expansion & Renewal Dashboard
Purpose: Track ARR growth beyond new business.
Key widgets:
- Expansion revenue by quarter (upsells/cross‑sells).
- Renewal pipeline by quarter, with risk categorization.
- Expansion and renewal win rates by segment.
Why it matters: Makes expansion and renewals visible as a deliberate revenue stream, not an afterthought.
6) Customer Health & CS Dashboard
Purpose: Give execs a sense of customer health and CS load.
Key widgets:
- Customers by health score band (if used) and ARR.
- Ticket volume and backlog by priority and segment.
- NPS/CSAT trends (if tracked in HubSpot).
Why it matters: Links customer experience to revenue risk and opportunity.
Cluster 4 – GTM Efficiency and SLAs
7) Speed‑to‑Lead & SLA Dashboard
Purpose: Ensure high‑intent leads are worked quickly and consistently.
Key widgets:
- Average/median time‑to‑first‑touch for demo/contact sales leads and other MQLs.
- % of leads meeting vs breaching SLAs.
- Leads with no owner or no activity in X hours/days.
Why it matters: Directly impacts conversion from leads to opportunities.
8) Sales Activity vs Outcome Dashboard
Purpose: Connect rep actions to pipeline and revenue.
Key widgets:
- Calls, emails, meetings per rep.
- New deals and Opportunities created per rep.
- Closed Won revenue per rep.
- Ratios: activity → opps, opps → wins.
Why it matters: Separates “activity for activity’s sake” from effective selling motions.
Cluster 5 – Data Integrity and System Health
9) Data Health Dashboard
Purpose: Track whether HubSpot data is reliable enough to run the business on.
Key widgets:
- % of Contacts with: owner, email, lifecycle, country/region.
- % of Companies with: owner, industry, ICP tier.
- % of Deals with: amount, close date, stage, associated company/contact.
- Duplicate and orphan records over time.
Why it matters: Underpins every other dashboard; without good data, the rest is theater.
10) Lifecycle & Pipeline Alignment Dashboard
Purpose: Ensure lifecycle stages and deals tell the same story.
Key widgets:
- Contacts by lifecycle stage (Lead, MQL, SQL, Opportunity, Customer).
- % of “Customers” without Closed Won deals.
- % of “Opportunities” with no associated Deals.
Why it matters: Fixes the silent drift between Marketing’s funnel view and Sales’ pipeline reality.
Cluster 6 – Profitability and Cohorts (Where Data Allows)
11) CAC & Payback Dashboard
Purpose: Link acquisition efforts to cost and payback.
Prereq: Cost data from finance/ads platforms integrated.
Key widgets:
- CAC by channel and segment.
- Pipeline and revenue vs spend.
- Estimated payback period for key motions.
Why it matters: Helps CEO/RevOps decide where to double down or pull back.
12) Cohort & Retention Dashboard
Purpose: See how customer value and retention behave over time.
Prereq: Revenue and churn data in or synced to HubSpot.
Key widgets:
- New customers by cohort (month/quarter) and current ARR.
- Retention/NRR by cohort.
- Churn reasons (if captured) by segment.
Why it matters: Surfaces whether your product and GTM are driving sustainable growth.
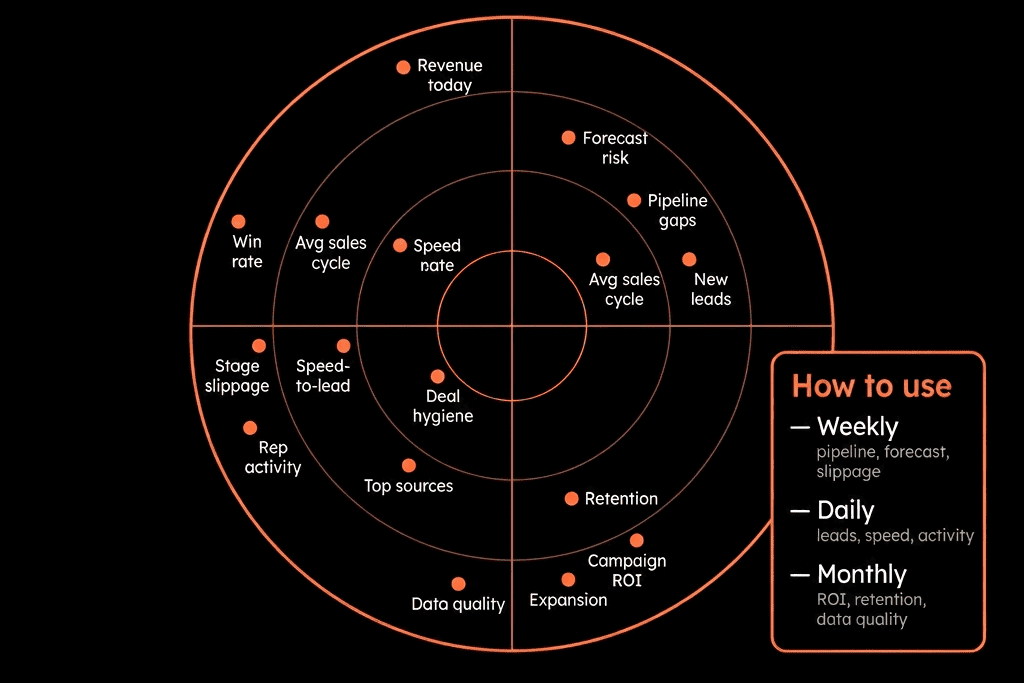
Cluster 7 – Segment, Territory, and Product Views
13) Segment & Territory Performance Dashboard
Purpose: Compare performance across key slices of the business.
Key widgets:
- Pipeline and Closed Won by segment (SMB/mid‑market/enterprise).
- Pipeline and Closed Won by territory/region.
- Pipeline and Closed Won by industry/vertical.
- Win rates and cycle length by those cuts.
Why it matters: Guides territory planning, quota setting, and segment strategies.
14) Product or Offer Performance Dashboard
Purpose: Show revenue health by product line or service offering.
Key widgets:
- New and expansion revenue per product.
- Pipeline by product vs target.
- Churn/downsells by product (if relevant).
Why it matters: Exposes where your portfolio is truly winning or struggling.
Cluster 8 – Board & Strategy
15) Board‑Ready Revenue Overview Dashboard
Purpose: Give CEOs a HubSpot‑powered view that can feed board decks.
Key widgets:
- New business, expansion, churned revenue by quarter.
- Pipeline coverage vs ARR/Bookings targets (current and next quarter).
- Funnel conversion and key GTM KPIs (win rate, cycle time).
- High‑level customer metrics (NRR, logo retention).
Why it matters: Minimizes manual spreadsheet work and builds trust that HubSpot data is good enough for the board.
How to Roll These Out Without Overwhelming the Org
You don’t have to build all 15 at once.
A pragmatic sequence:
Phase 1 (0–60 days)
- Executive Revenue Summary.
- Pipeline Health & Forecast.
- Full‑Funnel Conversion.
- Data Health.
Phase 2 (60–120 days)
- Channel & Campaign Performance.
- Speed‑to‑Lead & SLA.
- Sales Activity vs Outcomes.
- Expansion & Renewal.
Phase 3 (120–180 days)
- Customer Health & CS.
- Segment/Territory and Product Performance.
- CAC/Payback and Cohorts (once data is ready).
- Board‑Ready Overview.
At each stage:
- Validate definitions.
- Train leaders on how to use the dashboards.
- Tie insights to concrete actions.
Pulling It Together: Dashboards as a Leadership Tool, Not Just a Report Pack
For CEOs and RevOps leaders, these 15 dashboards are not a “nice‑to‑have” collection. They are:
- The way you see and steer the revenue engine.
- The basis for alignment conversations across Marketing, Sales, and CS.
- The early warning system for pipeline, funnel, and data issues.
The key is not just building dashboards—it’s:
- Ensuring definitions match reality.
- Keeping data quality high enough to trust them.
- Embedding them in your weekly, monthly, and quarterly rhythms.
Want Help Designing CEO‑ and RevOps‑Grade Dashboards in HubSpot?
If your current HubSpot reports don’t give leadership a clear, trusted view of the business, this is exactly where we can help.
Our HubSpot Portal Health Check and Migration & ROI Plan are designed to:
- Audit your current data and reporting.
- Define the right dashboard set for your stage and model.
- Implement or blueprint them so they run off clean, governed data.