

Targets in Slides, Forecasts in Spreadsheets, Dashboards in HubSpot = Chaos
Common pattern:
- Targets live in a finance or slide deck.
- Forecasts are managed in Excel or a separate tool.
- Dashboards in HubSpot show “what happened”, not “where we’re going”.
Result:
- Reps and managers operate on different numbers.
- Leadership can’t reconcile target vs forecast vs actual quickly.
- HubSpot becomes a rear-view mirror, not a cockpit.
When we architect this properly, HubSpot becomes the place where:
- Goals = what you intend to do.
- Forecast = what you expect to do.
- Dashboards = how you’re pacing and why.
Here’s how we wire them together.
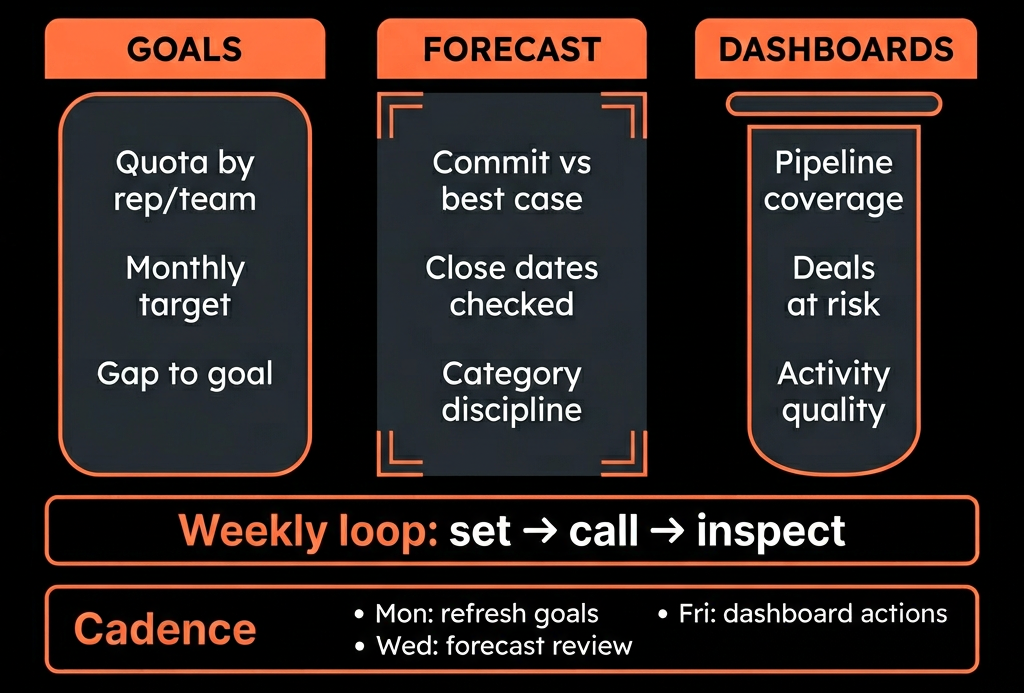
Step 1 – Define Your Target Structure Before Touching HubSpot
Start outside the tool for 30 minutes.
Decide:
Timeframes
- Monthly vs quarterly goals.
- Rolling 12-month view vs financial year.
Levels
- Per rep? Per team? Per region?
- Separate goals for New Business vs Renewals/Expansion?
Metrics
- Revenue (Closed Won amount).
- Deals created.
- Meetings booked.
- MQLs / SQLs (for marketing and SDR teams).
Document this in a simple matrix:
Rows = people/teams. Columns = metrics and periods.
Then bring that plan into HubSpot.
Step 2 – Configure HubSpot Goals for Revenue and Activity
In HubSpot’s Goals tool:
Create Revenue Goals
- Choose pipeline(s) and deal stages considered “Won”.
- Set monthly or quarterly targets per rep and per team.
- Separate goals for: New Business pipeline, Renewal/Expansion pipeline (if you track separately).
Create Activity Goals (where relevant)
- Meetings booked.
- New deals created.
- Calls/emails (only if truly important for your motion).
- MQLs/SQLs (sometimes better tracked via reports vs Goals, depending on edition).
Align ownership
- Make sure HubSpot owner values match your target definitions.
- Eg., if AE has a quota, deals they own must be assigned correctly.
Goals are now in the system as the “what”.
Step 3 – Implement a Clean Forecast Model
Next, set up Forecast based on your sales process.
Add a Forecast category field on Deals
- Values like: Pipeline, Best Case, Commit, Omitted.
Configure Forecast settings
- Select which pipelines to include.
- Map your Forecast category property.
- Define forecast submission cadence (weekly typical).
Train reps and managers
- Reps update forecast category and close dates on their deals weekly.
- Managers review and adjust Commit/Best where needed.
Now you have the “what we think will happen” in HubSpot.
Step 4 – Ensure Deals and Lifecycle Data Are Forecast-Ready
Before relying on Goals + Forecast + Dashboards, fix these basics:
Deals must have:
- Correct pipeline and stage.
- Realistic Amount and Close date.
- Owner set correctly.
Lifecycle alignment:
- Opportunities (= SQL) should create deals.
- Closed Won should align with Customer lifecycle.
Add workflows to:
- Flag deals with past-due close dates that aren’t Closed Won/Lost.
- Prevent Commit without certain fields completed (e.g., decision maker identified).
This keeps your forecast view from being fantasy.
Step 5 – Build Dashboards That Connect Goals, Forecast, and Actuals
Now we create dashboards that show targets vs expected vs actual.
5.1 Revenue Performance Dashboard
Reports:
Closed Won vs Goal
- Closed Won amount per period vs revenue goals.
- By rep and by team.
Forecast vs Goal vs Actual (time series)
- For the current quarter: Goal, Current Forecast Commit, Actual Closed Won to date.
Pipeline coverage vs Goal
- Pipeline amount for this period vs target (e.g., 3x).
- Split by stage or forecast category.
This lets leadership see:
- Are we ahead/behind goal?
- Is the forecast credible?
- Is there enough pipeline behind the forecast?
5.2 Team/Rep Scorecard Dashboard
Reports (per rep and per team):
- Closed Won vs goal (this month/quarter).
- Current Forecast Commit vs goal.
- Pipeline in period by stage.
- Key activity metrics: deals created, meetings, calls (only if meaningful in your context).
Managers can use this in 1:1s and team meetings.
5.3 Marketing & SDR Goals Dashboard (Optional but Powerful)
If you set Goals for marketing and SDR:
- MQLs vs goal.
- SQLs / Opportunities vs goal.
- Meetings booked vs goal.
Down-funnel views:
- Pipeline and revenue from marketing-sourced/SDR-sourced leads.
This connects top-of-funnel production to revenue outcomes.
Step 6 – Use Filters and Views to Make the Data Executable
Fine-tune dashboards for different audiences:
- Global leadership: All regions, all teams.
- Regional heads: Filtered by region, with the same structure.
- Team leads: Filters by pipeline/owner/team.
Set up:
- Saved Forecast views for each manager (e.g., “My team – this quarter forecast”).
- Saved Goal progress reports pinned to dashboards.
The structure stays the same; filters change per audience.
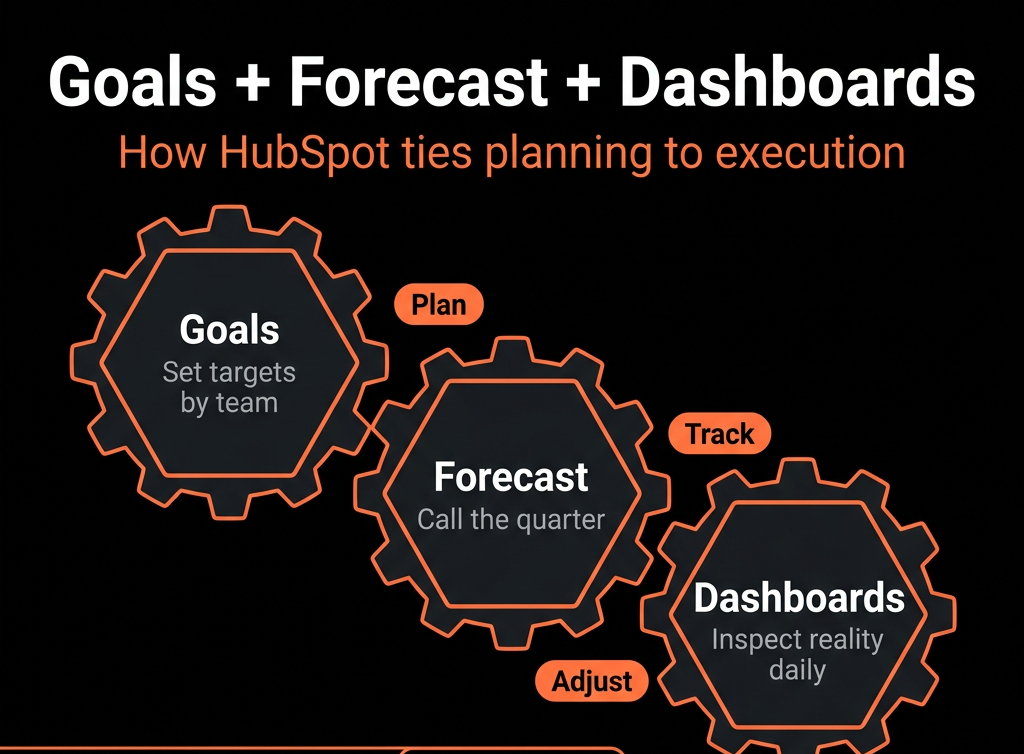
Step 7 – Establish a Weekly and Monthly Cadence
This is where the system comes alive.
Weekly (sales team)
- Reps: update deals (stage, amount, close date, forecast category).
- Managers: review forecast vs goal using the Forecast tool + dashboards.
- Focus on: Commit deals and gap to goal.
Monthly (leadership)
- Review: Goals vs actual so far, Forecast vs remaining goal, Pipeline coverage into next period.
- Decide: Where to push for more pipe, Where to adjust expectations/targets.
Quarterly
- Compare original goals vs forecast vs actual.
- Tune: Stage definitions, Forecast rules, Target setting for next quarter.
All conversations happen with HubSpot on screen, not offline spreadsheets.
Step 8 – Align Marketing and CS Around the Same Structure
Revenue doesn’t stop at new business.
For Marketing:
- Set and track goals for pipeline generated and revenue influenced, not just MQLs.
- Build dashboards that show marketing-sourced Closed Won vs goal.
For CS / Renewals (if on HubSpot for CS):
- Set NRR/GRR or renewal/expansion targets per owner/team (via Goals or dashboards).
- Show renewal pipeline forecast vs goal similar to new business.
This creates one goal/forecast/reporting spine across GTM.
Step 9 – Common Pitfalls and How to Avoid Them
Pitfall 1: Goals not matching how deals are logged
Fix: Align goals with specific pipelines, stages, and deal types. Document.
Pitfall 2: Forecast categories used inconsistently
Fix: Train reps, and enforce via workflow rules and manager reviews.
Pitfall 3: Dashboards that ignore goals
Fix: Always include at least one goal vs actual view on exec dashboards.
Pitfall 4: Changing targets mid-period with no history
Fix: Document target changes (descriptions, notes) and avoid constant adjustments.
Step 10 – Iterate Based on Accuracy and Behavior
Over 2–3 quarters:
- Measure forecast accuracy against goals and actuals by team/rep.
- Identify where your process or stages mislead the forecast.
Adjust:
- Stage definitions.
- Commit rules.
- Targeting strategy.
The goal is simple:
If HubSpot says you’re going to land at X, reality should land near X—more often than not.
Want Help Wiring Goals, Forecast, and Dashboards Into One System?
If you’re setting targets in slides, forecasting in spreadsheets, and reporting in HubSpot, you’re working much harder than you need to.
Through our HubSpot Portal Health Check and Migration & ROI Plan, we:
- Review your pipelines, stages, and current reporting.
- Design a goals + forecast + dashboards model that matches how you really sell.
- Implement the right deal fields, forecast categories, goals, and dashboards.
- Coach your leaders to run pipeline and performance reviews entirely from HubSpot.
- So every conversation about “the number” uses one set of live, trusted data.