

Leadership Needs One Page, Not Ten Tools
CEOs and CROs don’t want to click through 15 reports.
They want to open HubSpot and see:
- Are we on track for the number?
- Is next quarter safe?
- Where is revenue leaking—funnel, pipeline, or retention?
- Which channels and segments are working?
A Revenue Command Center in HubSpot is a small set of dashboards, tuned for leadership, that answers these questions live.
Here’s how we design it.
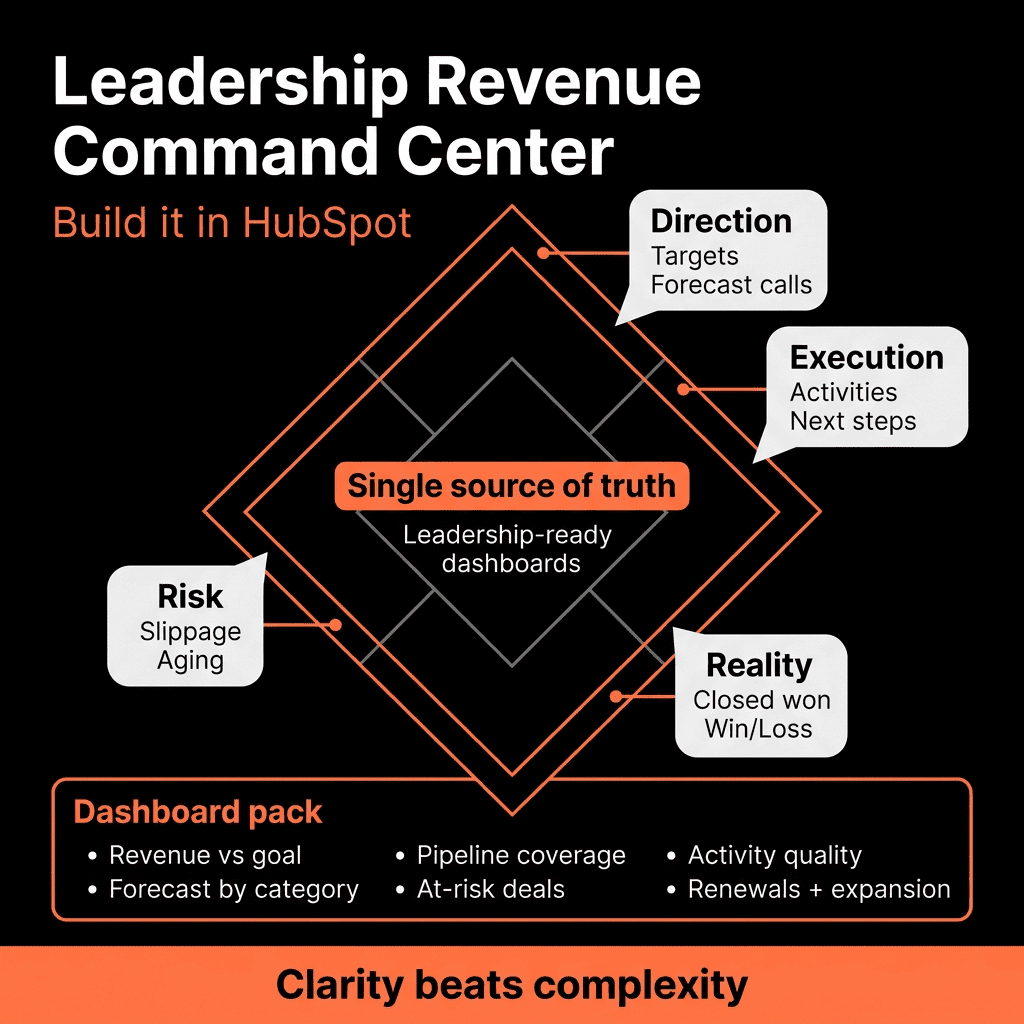
Step 1 – Decide the 5–7 Questions Leaders Must Answer in Seconds
Anchor the Command Center around a few critical questions:
- Are we hitting our new business and expansion targets?
- Is our pipeline for this and next quarter strong and real?
- Are we keeping and growing existing customers (NRR/GRR)?
- Is our funnel converting at healthy rates across marketing and sales?
- Which segments and channels are driving profitable revenue?
- Where are the biggest risks right now?
Each question becomes a section on one or two dashboards.
Step 2 – Make Sure the Core Revenue Data Is “Good Enough”
You don’t need perfection, but you do need:
Clean pipelines:
- Separate New Business / Renewals / Expansion.
- Clear deal stages.
Reliable deal fields:
- Amount, Close date, Deal stage, Pipeline, Deal type.
Basic customer fields:
- Customer status, Industry, Company size, Region, MRR/ARR (if recurring).
Working lifecycle:
- Contacts moving from Lead → MQL → SQL/Opportunity → Customer consistently.
If these are broken, fix them first or your Command Center becomes a “data fight” center.
Step 3 – Dashboard 1: Executive Revenue Snapshot
This is the “home screen” for leadership.
Key reports (current quarter, with comparison):
New business vs target
- Closed Won amount (Deal type = New).
- Against quota/goal by month/quarter.
Renewal & expansion vs target
- Closed Won amount where Deal type = Renewal/Expansion.
- Optional: GRR/NRR summary.
Pipeline coverage
- Pipeline amount for this and next quarter vs target (e.g., 3–4x).
- Split by stage or by New/Renewal/Expansion.
Revenue by segment
- Closed Won by industry, company size, or region.
Leadership can glance and see: “On track / behind / where it’s coming from.”
Step 4 – Dashboard 2: Pipeline Health & Forecast
This gives depth on forward-looking revenue.
Include:
Pipeline by stage (this and next quarter)
- Deal amount by stage.
- Filters for New/Renewal/Expansion.
Stage-to-stage conversion
- Funnel view showing conversion rates across stages.
- Highlights where deals die.
Time in stage
- Average days spent in each stage.
- Long dwell times = risk.
Forecast vs target by team/rep
- Using Forecast category (Pipeline / Best / Commit).
- Shows Commit vs goal and Best Case upside.
Leaders use this to sanity-check forecast calls and pipeline quality.
Step 5 – Dashboard 3: Customer & NRR View
Make existing revenue as visible as new business.
Reports:
Renewal pipeline
- Renewal deals by stage and close date.
- Highlight this and next quarter.
Churn and retention
- Renewal deals Closed Won vs Closed Lost (amount).
- GRR and NRR trend (quarterly).
Expansion pipeline and performance
- Expansion deals by stage and amount.
- Expansion Closed Won per period.
Customer health & risk
- Accounts by Health band (R/A/G) and MRR/ARR.
- At-risk accounts list (with renewal dates).
This lets leadership see: “How safe is our base, and where are we growing it?”
Step 6 – Dashboard 4: Full-Funnel & Attribution View
Tie marketing and sales to the same revenue story.
Include:
Lead → MQL → SQL → Opportunity → Customer funnel
- Volume and conversion rates per stage.
- Filter by segment (industry, region, size).
Pipeline and revenue by channel
- Using Original source or normalized channel property.
- Deals created + Closed Won by channel.
Pipeline and revenue by campaign
- Top campaigns by MQLs, opportunities, and Closed Won amount.
Cost/efficiency (where data exists)
- If you have spend data, approximate CAC or ROAS by channel/campaign.
Leadership uses this to make budget and GTM bets based on revenue, not just leads.
Step 7 – Dashboard 5: Risk & Operational Health
Surface the early-warning signals.
Reports:
Stale pipeline
- Deals with no activity in X days, by stage.
- Deals with close dates in the past, still open.
SLA breaches
- MQLs not touched within SLA (e.g., 24 hours).
- Tickets breaching response/resolution SLAs (if Service Hub).
Data hygiene KPIs
- % of deals missing key fields (decision maker, next step).
- % of contacts/companies without segmenting info.
Activity quality (optional but powerful)
- Connection rates, reply rates, show rates (high level).
This view tells leadership where processes, not just numbers, are at risk.
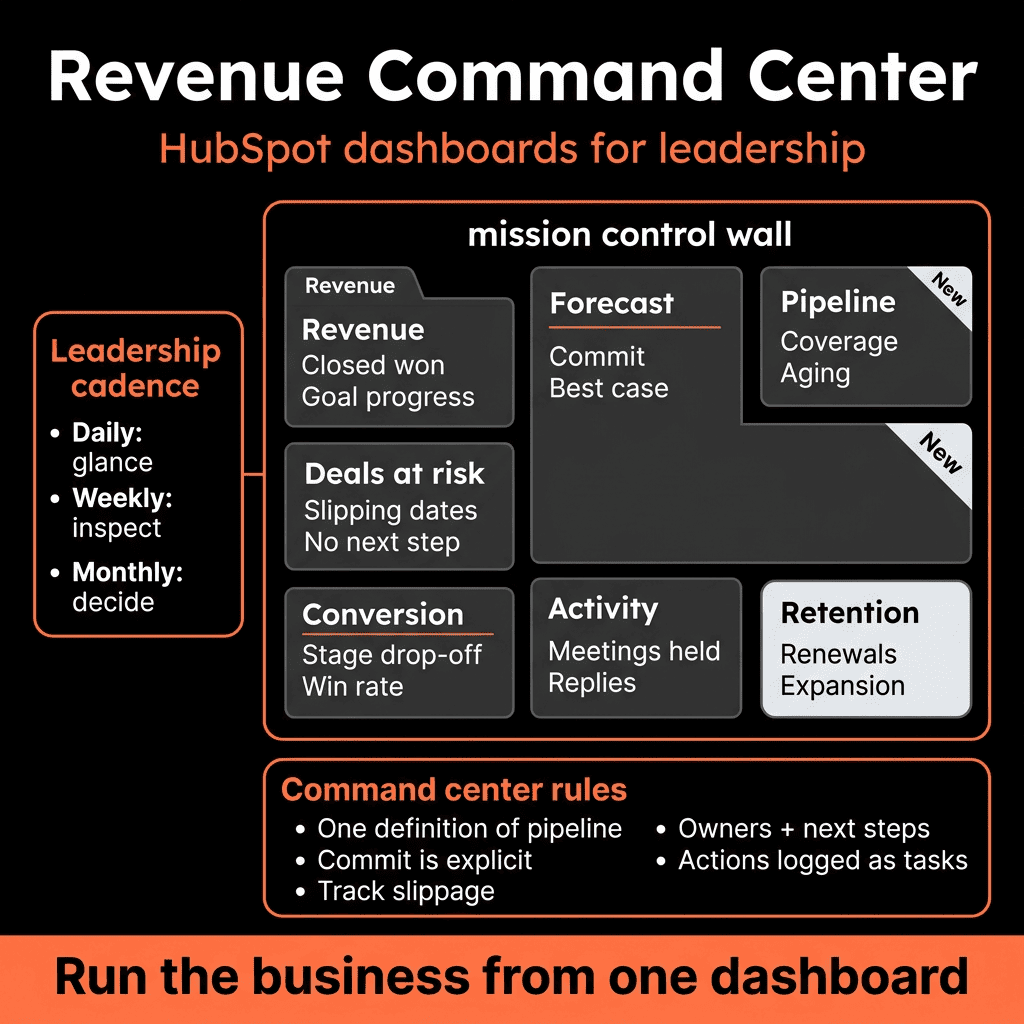
Step 8 – Design for Leadership: Filters, Descriptions, and Schedules
Make the Command Center usable for non-admins:
- Use consistent date filters (e.g., “This quarter” with compare to last).
- Add short descriptions to key reports: what it shows, why it matters.
- Group reports logically on each dashboard with clear section headers.
- Save filter variants (e.g., global / EMEA / SMB / Enterprise).
Then:
- Set up scheduled emails of key dashboards to execs weekly/monthly.
- Encourage them to click through into HubSpot, not just read screenshots.
Step 9 – Run Leadership Meetings Out of the Command Center
To build trust in HubSpot as the source of truth:
Use these dashboards live in:
- Weekly leadership huddles.
- Monthly GTM reviews.
- Quarterly board prep (as a base).
When numbers are questioned:
- Drill down from report to segment → rep → individual deals.
- Show how data rolls up.
Over time, “Can you export that to Excel?” should disappear.
Step 10 – Iterate the Command Center Based on the Questions Leaders Ask
For the first 1–2 quarters:
- Note which questions leadership keeps asking that require:
- Extra filters.
- Manual analysis.
- New fields.
Adjust:
- Add or update properties.
- Refine lifecycle/stage logic.
- Add or swap specific reports.
The Command Center is a living asset: it should evolve with strategy and GTM model.
Want a Revenue Command Center Built on Top of Your Existing HubSpot?
If leadership still trusts spreadsheets and screenshots more than HubSpot, that’s usually a design and data problem—not a tooling problem.
Through our HubSpot Portal Health Check and Implementation Blueprints / Migration & ROI Plan, we:
- Audit your current data model, pipelines, and reports.
- Design an executive “Revenue Command Center” tailored to your GTM and targets.
- Fix the minimum data and process issues needed for reliable views.
- Train your leadership team to use HubSpot as their daily/weekly revenue cockpit.
- So you can run the business from one live view of revenue—without chasing exports.