

Stop Exporting to Excel for Every QBR
Most QBRs are still run out of:
- Spreadsheets.
- Static slide screenshots.
- One-off analyst pulls.
Data is late.
Context is missing.
Nobody trusts the numbers.
We prefer a different model:
“Open the HubSpot dashboards, filter to last quarter, and run the review live.”
That only works if HubSpot is set up to tell the full revenue story.
Below is how we structure quarterly reviews using only HubSpot dashboards.
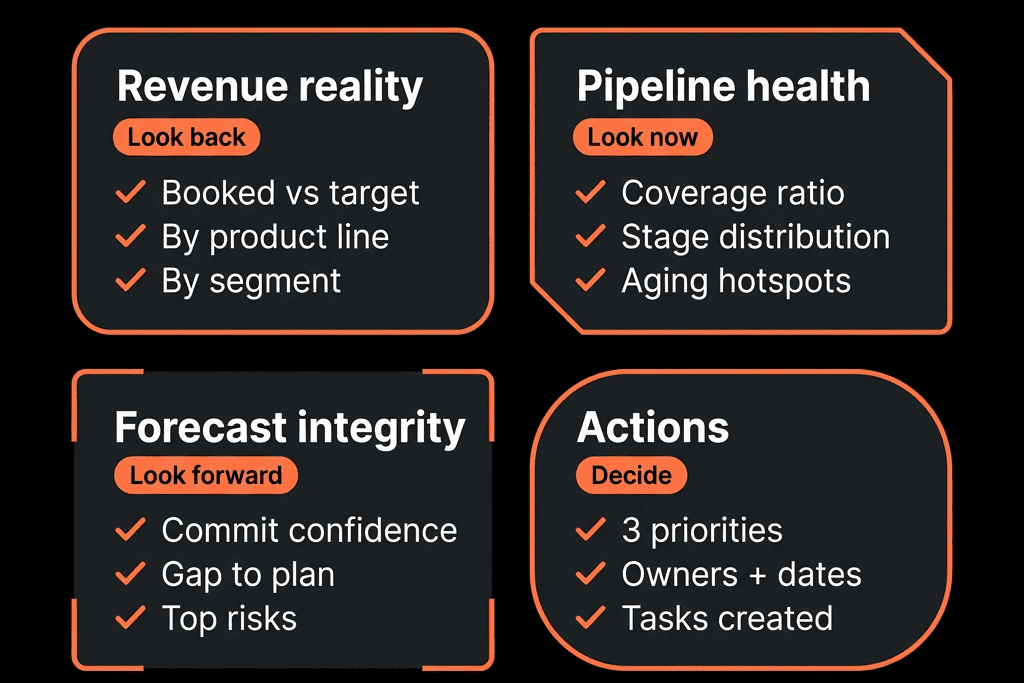
Step 1 – Define the Questions Your QBR Must Answer
Before building anything, agree what the QBR must cover.
Typical leadership questions:
How did we perform vs target for:
- New ARR/Revenue.
- Expansion/upsell.
- Renewals/retention (NRR/GRR where possible).
What drove that performance?
- Pipeline created.
- Conversion rates by stage.
- Win rates and sales cycle length.
- Channel and campaign performance.
Where did we lose revenue?
- Lost deals and reasons.
- Churn and downgrades.
- Missed SLAs or process breakdowns.
What changes are we committing to next quarter?
- ICP or segment focus.
- Process changes.
- Plays for marketing, sales, CS.
Write these as a one-page QBR agenda.
Every dashboard must map back to one of these questions.
Step 2 – Clean Up Core Revenue Data Inputs
Dashboards are only as good as their inputs.
You don’t need perfection, but you need minimum viable hygiene:
Deal properties:
- Create date, Close date, Amount, Deal stage.
- Pipeline, Deal type (New / Renewal / Expansion).
- Closed won reason, Closed lost reason.
Company/contact properties (for segmentation):
- Industry, Company size, Region, ICP fit (if used).
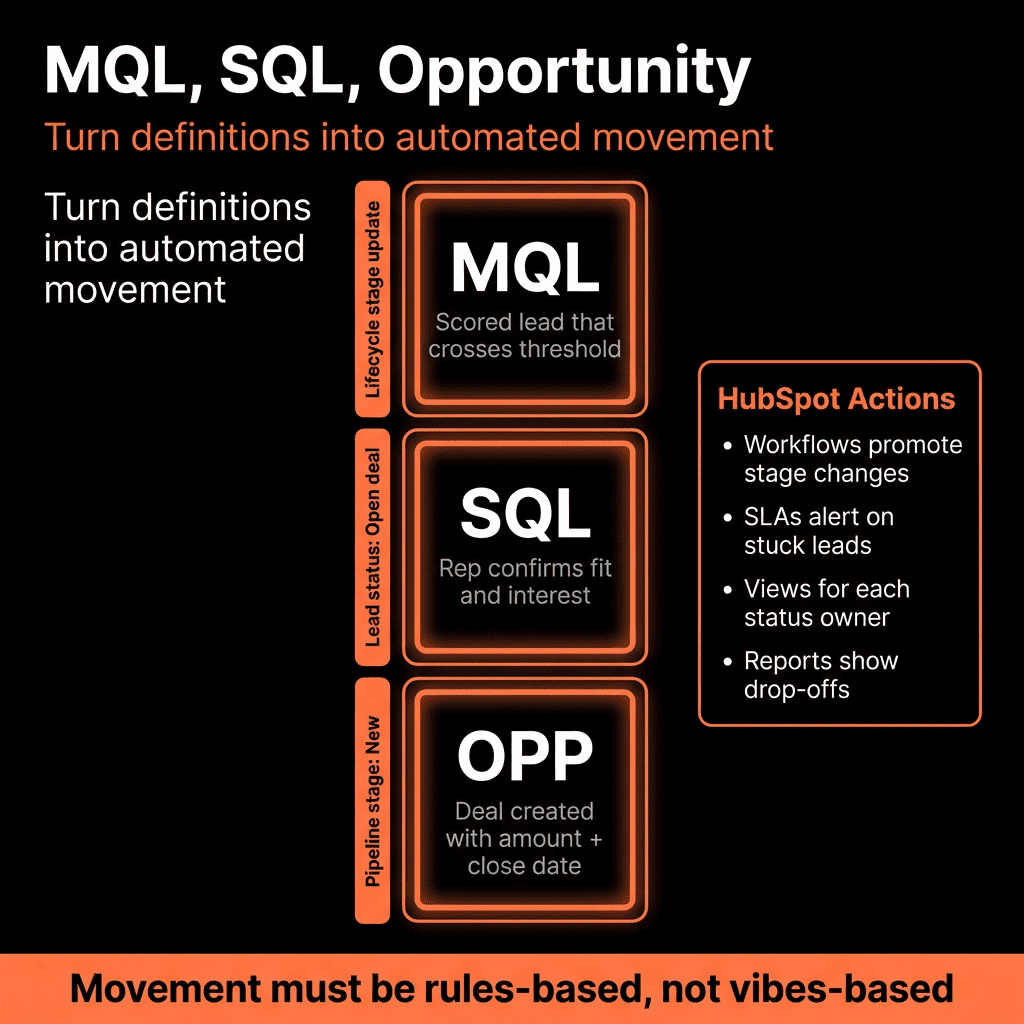
Lifecycle consistency (Lead → MQL → SQL → Opportunity → Customer).
If these are broken, fix them first or your QBR will turn into a data argument.
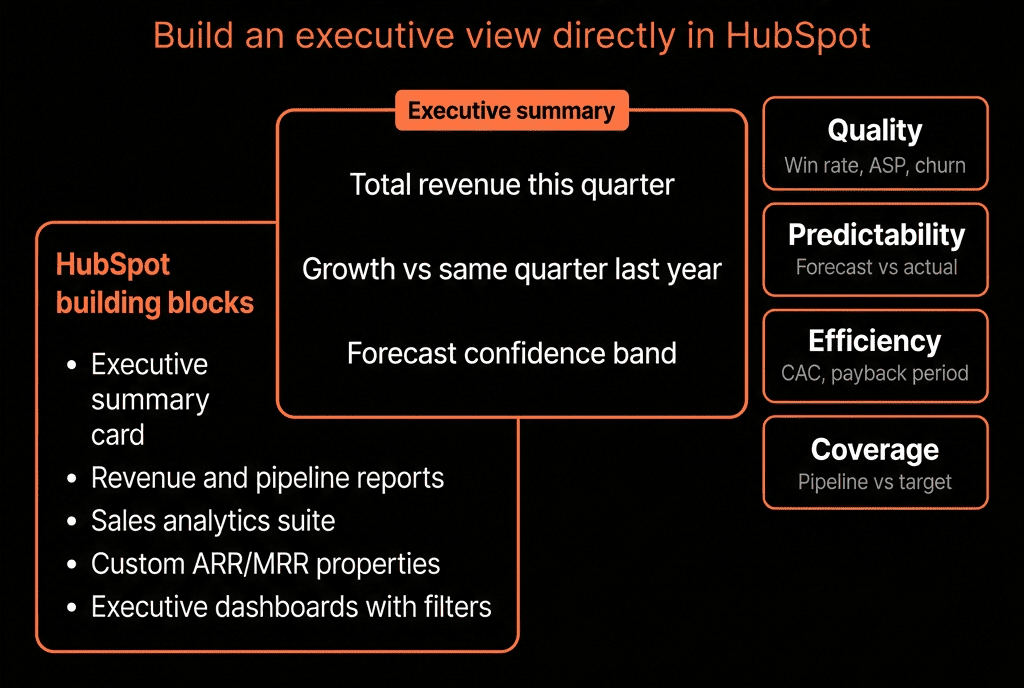
Step 3 – Build the Executive Overview Dashboard
This is the “start here” dashboard for the QBR.
Key reports (all filtered to Last quarter):
New business vs target
- Closed Won amount (New Business pipeline / Deal type = New).
- Add Target as goal (HubSpot goals or custom target reference).
Renewal and expansion vs target
- Closed Won amount where Deal type = Renewal/Expansion.
- If you track churn deals, calculate GRR/NRR with custom reports.
Pipeline coverage & health snapshot (as of quarter end)
- Pipeline amount by stage.
- Pipeline coverage vs next quarter’s target (e.g., 3x target).
Revenue by segment
- Closed Won amount by industry, company size, or region.
This dashboard answers:
“Did we hit the number and where did revenue come from?”
Step 4 – Build the Pipeline & Conversion Dashboard
Next, we explore how deals moved.
Include:
Deals created by month (or week) and pipeline
- Show volume and value.
- Compare to prior quarter to see top-of-funnel health.
Stage-to-stage conversion rates
- Funnel or custom report: from initial stage → Closed Won.
- By pipeline or segment where relevant.
Average time in stage
- Bar chart by stage.
- Highlights bottlenecks and friction points.
Win rate by stage entered
- Once a deal reached Stage X, what % ended as Closed Won?
- Used to see which stages are “fake progress”.
This dashboard answers:
“Did we have enough pipeline, and did we move it effectively?”
Step 5 – Build the Win/Loss & Deal Quality Dashboard
Now we focus on why we win or lose.
Key components:
Overall win rate
- % of deals created last quarter that are now Closed Won vs Lost (or still Open).
- Break down by segment, deal size, or product.
Win rate by segment
- Industry, company size, region, or ICP fit.
- Identify high-W/L segments.
Closed lost reasons
- Bar/pie chart of amount and count by Closed lost reason.
- Trend over quarters to see if issues are improving or getting worse.
Sales cycle length
- Average days to close by segment or deal size.
- Compare to previous quarter.
Deal quality indicators (optional but powerful)
- If you track properties like Decision maker identified, Champion identified:
- Report win rate by those fields (Yes/No).
- Shows behavior patterns that correlate with winning.
This dashboard answers:
“What kind of deals do we win, and where do we consistently lose?”
Step 6 – Build the Demand & Attribution Dashboard
This is where marketing and RevOps join the dots.
Include:
Pipeline and revenue by source/channel
- Use Original source / your normalized channel property.
- Reports:
- Deals created by channel.
- Closed Won amount by channel.
Pipeline and revenue by campaign
- If you use HubSpot Campaigns:
- Custom report: revenue influenced / revenue attributed by campaign.
- Or use your own Attribution campaign fields.
Volume vs quality views
- Contacts created by channel vs:
- MQLs and SQLs.
- Opportunities.
- Closed Won deals.
CAC input proxies (basic)
- If spend is tracked by channel/campaign externally, you can add manual properties or reference metrics for rough “revenue per channel per quarter” comparisons.
This dashboard answers:
“Which channels and campaigns are actually driving pipeline and revenue, not just leads?”
Step 7 – Build the Customer & Retention Dashboard
For a real revenue review, you can’t stop at the initial sale.
Use:
Customer count and revenue over time
- New customers vs churned customers.
- Net customer change.
Renewal performance
- Deals with Deal type = Renewal.
- Renewal rate by segment or product.
Churn and downgrade analysis
- Closed Lost renewal/expansion deals by Closed lost reason.
- Amount of churn vs expansion.
Support and success signals (if using Service Hub)
- Tickets by account near renewal (open vs closed).
- NPS/CSAT by segment.
- High-risk accounts flagged.
This dashboard answers:
“How healthy is our existing revenue base?”
Step 8 – Build the Operational Health & SLA Dashboard
This is the operational layer that explains many downstream revenue issues.
Include:
Speed-to-lead
- Time from contact creation / form submission to first contact.
- Segment for high-intent forms.
Lead follow-up SLAs
- % of MQLs/SQLs contacted within X hours.
- By team or rep.
Task and activity completion
- Tasks created vs completed.
- Calls/meetings/emails logged per rep per segment.
Data hygiene indicators
- % of deals with required properties filled (e.g., decision maker, next step).
- % of contacts/companies missing key fields.
This dashboard answers:
“Are our processes being followed in a way that supports revenue?”
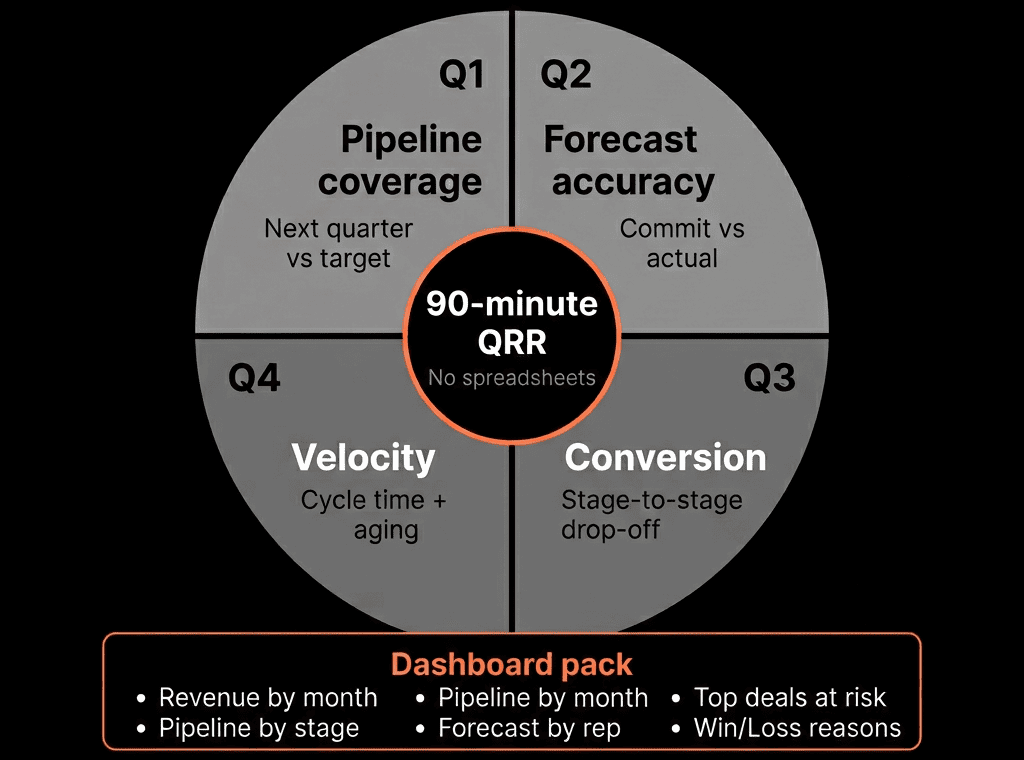
Step 9 – Run the QBR Live in HubSpot, Not in Slides
When the dashboards are ready:
Create a folder of QBR dashboards in HubSpot:
- QBR – Executive Overview
- QBR – Pipeline & Conversion
- QBR – Win/Loss & Deal Quality
- QBR – Demand & Attribution
- QBR – Customer & Retention
- QBR – Operational Health
Before the meeting:
- Lock filters to last quarter (with comparison to previous).
- Add brief descriptions to key reports so non-admins understand them.
During the QBR:
- Share your screen with the live dashboards.
- Drill into segments or reps when something looks off.
- Capture decisions and actions in notes/tasks directly against dashboards or records.
The narrative becomes:
“Here’s what happened, why it happened, and what we’re going to change next.”
No more:
“Hold on, this number doesn’t match my spreadsheet.”
Step 10 – Turn QBR Insights Into Concrete HubSpot Changes
A QBR without execution is just theater.
For each major insight, ask:
“What change do we need in HubSpot to address this?”
Examples:
- Low win rate in a segment → refine ICP properties and routing rules.
- Deals stalling in a stage → tighten stage definitions and add Playbooks.
- Slow speed-to-lead → adjust routing workflows and add SLA alerts.
- Poor attribution → improve source tracking and attribution stamping workflows.
Create a simple RevOps backlog:
Items prioritized and turned into HubSpot changes before the next quarter.
Next QBR, you review:
“We made these changes. Here’s how metrics responded.”
Now HubSpot is not just where you look at results—it’s where you change them.
Want QBR-Ready Dashboards Without Rebuilding Your Entire HubSpot?
If your quarterly reviews still depend on exports and hero spreadsheets, we can help.
Through our HubSpot Portal Health Check and Managed RevOps Retainer / Migration & ROI Plan, we:
- Audit your current objects, properties, and reports.
- Design a QBR-ready dashboard pack mapped to your revenue model.
- Fix the minimum data and process issues needed for reliable views.
- Train your leadership team to run reviews live inside HubSpot.
- So you can retire the “spreadsheet QBR” and make HubSpot the single place where revenue is measured and managed.
- make sure dont miss any word