

“It’s Just a Bit Messy” Is Costing You More Than You Think
Most teams know their HubSpot portal isn’t perfect.
They say things like:
- “The data’s a bit messy, but we manage.”
- “We’ll clean it up when we have time.”
- “Our reports are close enough for now.”
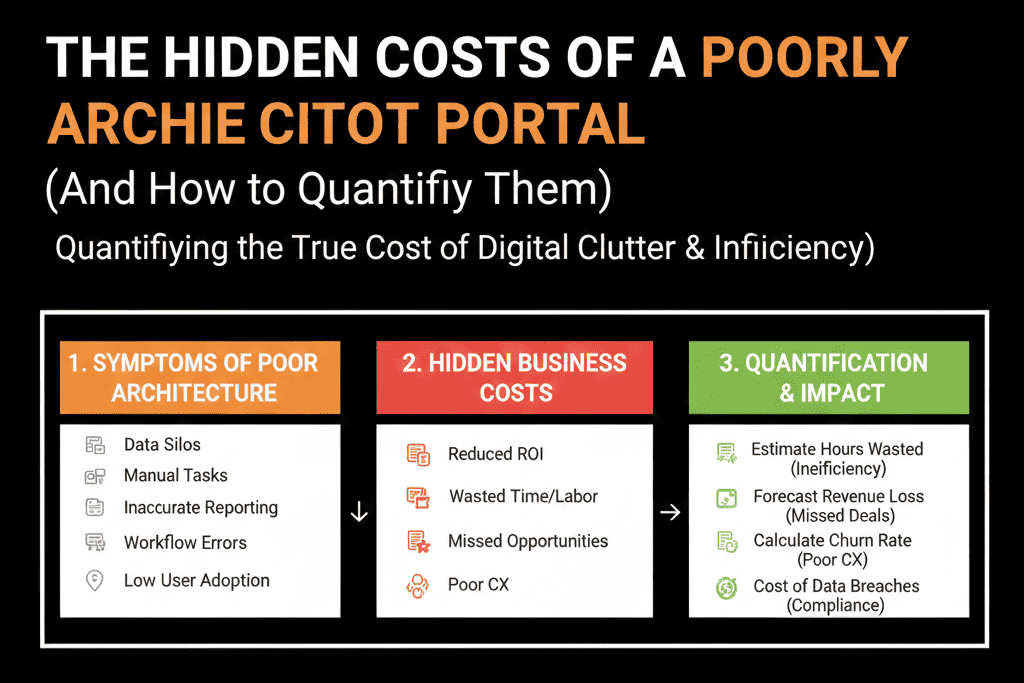
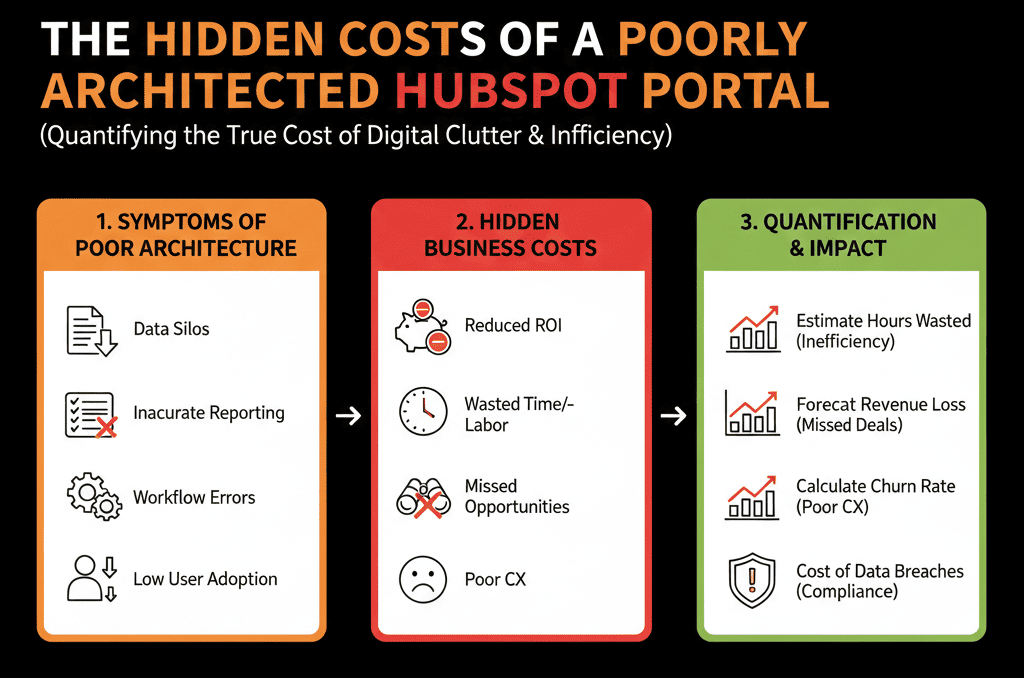
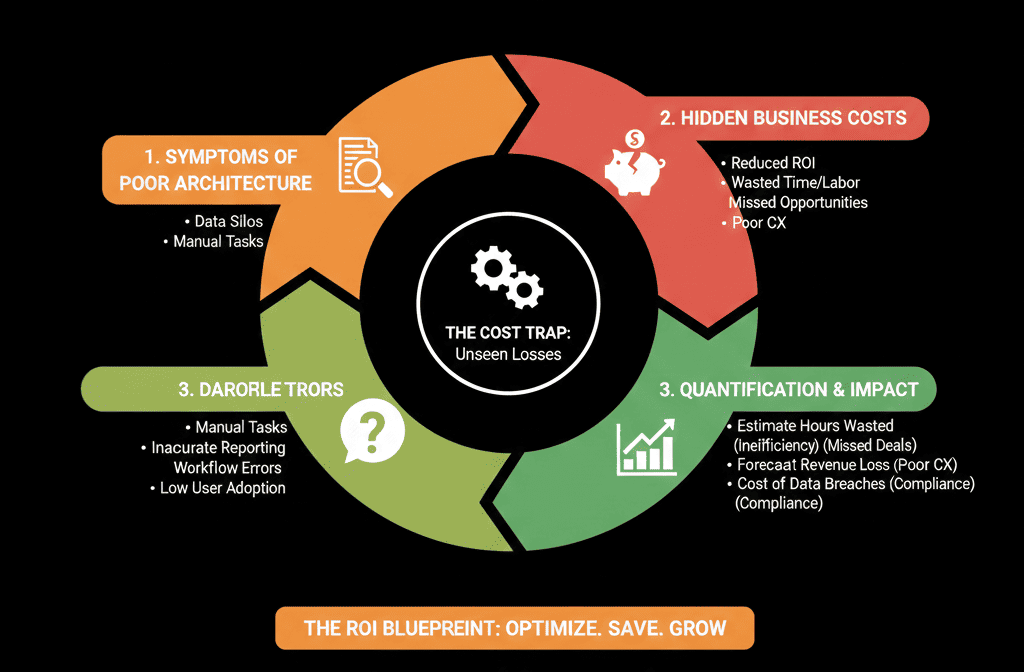
What they don’t see is the real financial cost of that messy architecture:
- Wasted hours across sales, marketing, and ops.
- Lost deals and slower revenue cycles.
- Bad decisions driven by incomplete or wrong data.
- Extra spend on tools and workarounds.
In this article, we’ll break down the hidden costs of a poorly architected HubSpot portal and show you simple ways to quantify them so you can make a business case for fixing the foundation.
Cost Area 1 – Wasted Time Across Sales and Marketing
Poor architecture shows up as friction in everyday work:
- Reps hunting for the right views and fields.
- Marketers rebuilding lists and reports from scratch.
- RevOps manually untangling data for leadership.
How to estimate this cost
Pick a conservative scenario:
- Sales team: 10 reps.
- Each rep wastes 15 minutes per day dealing with bad views, duplicate records, or confusing fields in HubSpot.
That’s:
- 15 min × 10 reps × 5 days = 750 minutes / week
- 750 / 60 = 12.5 hours / week
- ~50 hours per month.
Now apply a rough fully loaded cost (salary + overhead):
- Assume $50/hour → 50 hours × $50 = $2,500 per month
- Annually: $30,000+ in wasted rep time alone.
Now add:
- Marketing ops spending an extra 10 hours/month fixing lists and reports.
- RevOps/ops spending 10–20 hours/month on manual cleanup and firefighting.
You quickly see tens of thousands per year quietly leaking out through inefficient daily work.
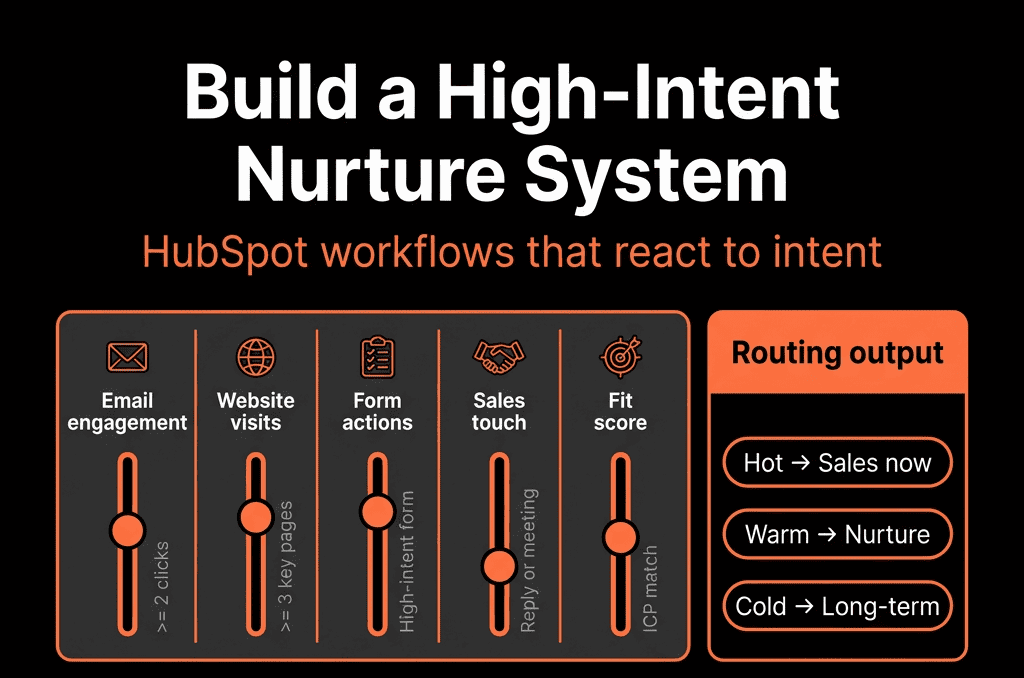
Cost Area 2 – Slower Speed-to-Lead and Dropped High-Intent Leads
Bad architecture often means:
- Lead routing is unclear or broken.
- Forms don’t map cleanly to lifecycle or owner.
- SLAs are not enforced or visible.
Result:
High-intent inbound leads sit untouched—or reach the wrong person.
How to estimate this cost
Example:
You get 100 high-intent leads/month (demo, trial, contact sales).
Industry data and your own numbers show:
- If contacted within 1 hour → 30% conversion to opportunity.
- If contacted after 24 hours → 10% conversion to opportunity.
If poor routing means half of those leads get slow follow-up:
- 50 leads get fast follow-up → 15 opportunities (30%).
- 50 leads get slow follow-up → 5 opportunities (10%).
That’s 10 lost opportunities per month due to speed alone.
If an average opportunity is worth $10,000 in pipeline:
- 10 × $10,000 = $100,000 in pipeline lost monthly.
Even at a 25% win rate, that’s $25,000 in revenue potential monthly.
Annually: $300,000+ in preventable leakage.
All from weak lead management and HubSpot architecture.
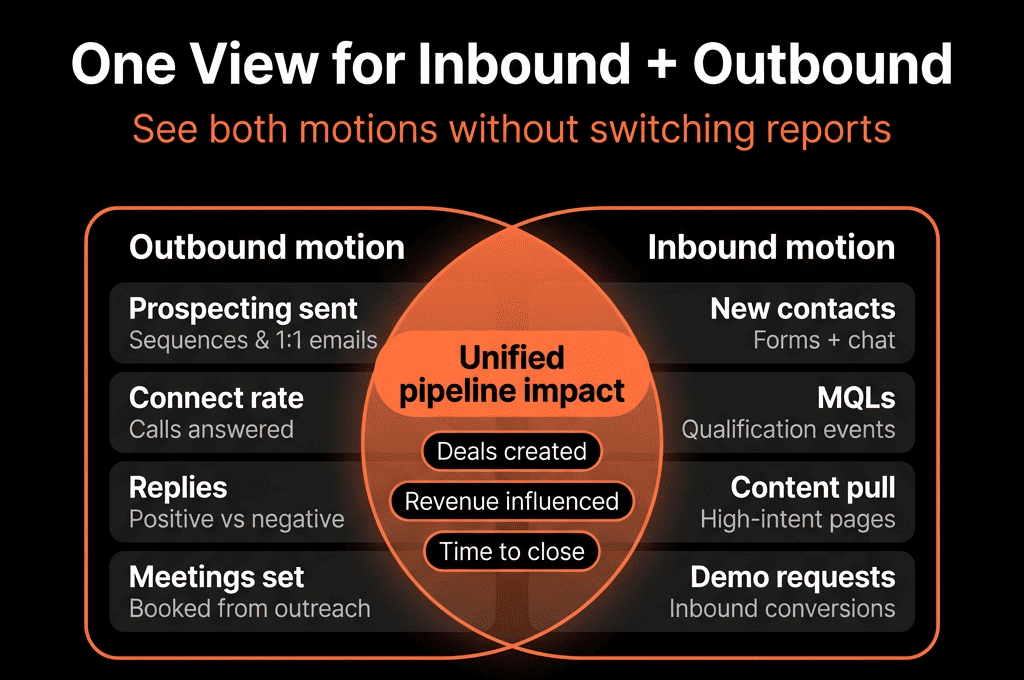
Cost Area 3 – Forecast Inaccuracy and Bad Strategic Calls
If your pipelines, stages, and deal data aren’t architected properly:
- Forecasts don’t match reality.
- Leadership makes hiring, budget, and go-to-market decisions on shaky numbers.
- Missed targets catch everyone by surprise.
How to estimate this cost
Look back over the last 2–4 quarters:
- Compare your forecast vs actual:
- How far off were you (in % and absolute $)?
- How often were you surprised late in the quarter?
Now, estimate the impact of a 10–20% forecast miss:
If your quarterly target is $1M and you consistently miss by 15% because forecasts are wrong:
- That’s $150,000 per quarter of unexpected variance.
What does that cause?
- Over- or under-hiring.
- Over-spending or under-investing in channels.
- Delayed decisions because leadership doesn’t trust the data.
Even if only a fraction of that variance is due to poor HubSpot architecture (bad stages, weak data discipline, fragmented reporting), that’s easily six figures of risk tied directly to the CRM.
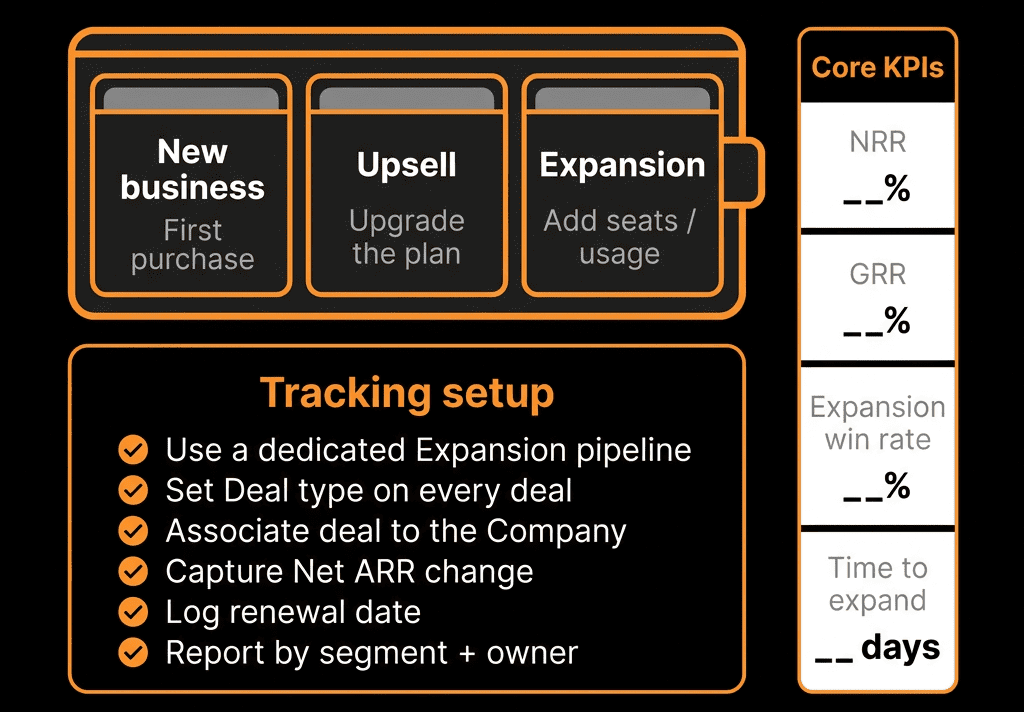
Cost Area 4 – Lost Cross-Sell, Upsell, and Retention Opportunities
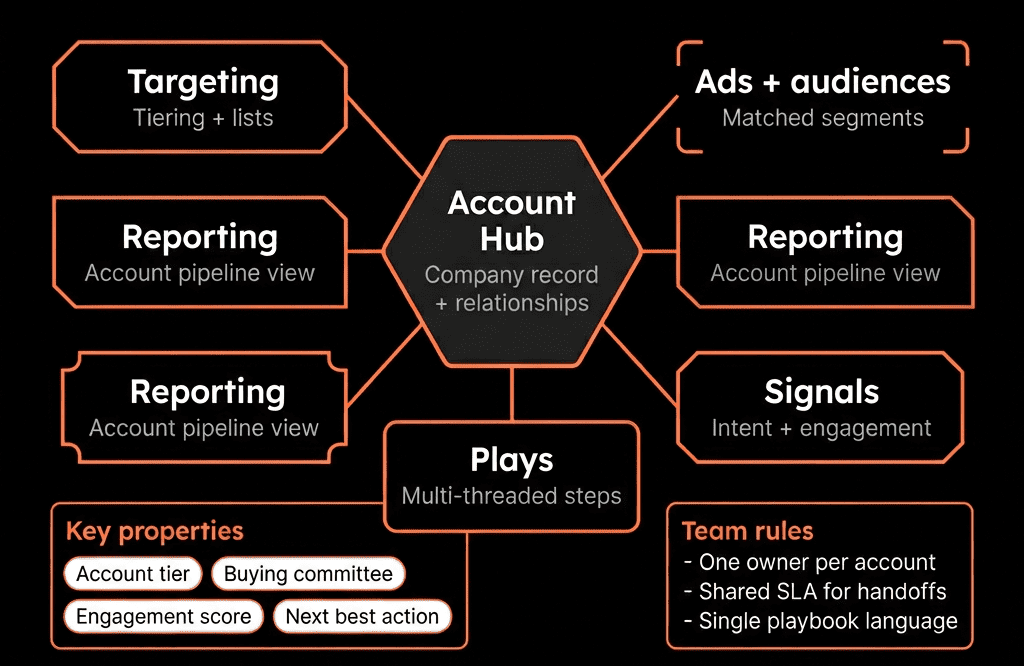
When your data model is messy:
- Contacts and companies aren’t associated properly.
- Products, brands, or subscriptions aren’t modeled cleanly.
- CS and sales don’t see a full customer view.
This causes:
- Missed handoffs from new business to CS.
- Missed triggers for expansion or renewal outreach.
- Poor visibility into existing customer engagement.
How to estimate this cost
Look at:
- Annual revenue from existing customers (renewals + upsells).
- Your current expansion/upsell rate (as % of base).
Ask:
If better visibility and triggers improved expansion by even 5–10%, what would that be worth?
Example:
- $2M annual revenue from existing customers.
- If better architecture adds just 5% expansion uplift:
- 0.05 × $2M = $100,000/year.
Often, we see much larger uplift once retention and expansion motions are enabled properly in HubSpot.
Cost Area 5 – Extra Spend on Workarounds and Duplicate Tools
Poor HubSpot architecture frequently leads to:
- Buying extra tools for things HubSpot could do if architected well.
- Exporting everything to spreadsheets or BI tools just to get basic views.
- Paying freelancers or agencies for one-off fixes instead of structural work.
How to estimate this cost
List:
- Tools you’re paying for that overlap with HubSpot capabilities (email tools, routing tools, basic reporting tools, survey tools, etc.).
- Average monthly/annual spend on those.
Then ask:
- With a solid HubSpot architecture, how many could be consolidated or downsized?
- What’s the annual savings if you cut even 1–2 overlapping tools?
Example:
- Reducing $1,000–$3,000/month in extra SaaS spend = $12,000–$36,000/year.
Add the agency/freelancer hours spent repeatedly “fixing things” instead of building a solid system once.
Cost Area 6 – Onboarding and Training Drag
Messy portals slow down new hires:
- They need custom training to navigate all the exceptions and quirks.
- They can’t self-serve because nothing is standardized.
- Managers spend more time explaining the system than coaching selling.
How to estimate this cost
Estimate for a typical sales hire:
Extra time to ramp in a messy system vs a clean one:
e.g., 4 weeks vs 3 weeks to reach a productive activity level.
Difference:
1 extra week of ramp × cost of the rep × number of hires per year.
If you hire 5 reps/year and each loses 1 extra unproductive week worth ~$2,000 in salary/overhead:
- 5 × $2,000 = $10,000/year in onboarding drag, not including opportunity cost of slower ramp to quota.
Do similar math for marketing and CS hires.
Pulling It Together: A Simple Cost Model
You don’t need a perfect model. You just need a credible order-of-magnitude.
For your company, roughly estimate annually:
- Time waste (Sales, Marketing, RevOps): Extra hours/month × blended hourly rate × 12.
- Lost pipeline from slow or misrouted leads: Estimated lost opportunities/month × avg deal size × win rate × 12.
- Forecast inaccuracy and misallocation (conservative): 5–10% of annual target × fraction attributable to bad data/architecture.
- Missed expansion/retention uplift: 3–10% of existing customer revenue.
- Extra tools and workarounds: Overlapping SaaS tools + agency/freelance “fix” hours.
- Onboarding drag: Extra ramp time × hires/year × cost per week.
Even with very conservative assumptions, it’s common to see:
$50,000–$250,000+ per year in impact from a poorly architected HubSpot portal—before counting larger strategic risks.
Why This Matters for Getting Budget and Buy-In
Leaders rarely approve “clean up HubSpot” projects just because the system is annoying.
They do approve:
- Projects with a clear financial case.
- Initiatives that reduce risk and improve decision quality.
- Investments that unlock growth (faster sales cycles, better pipeline visibility).
When you quantify the costs, you can say:
“We’re likely losing at least $X per year due to how HubSpot is architected today.
A structured audit and re-architecture project costing a fraction of that would pay for itself quickly.”
That’s when conversations change from “nice to have” to “we can’t afford not to.”
Want Help Quantifying and Then Fixing Your HubSpot Architecture Problem?
If you suspect your HubSpot portal is costing you far more than the subscription fee—but you don’t have a clear way to prove it—this is where we can help.
Our HubSpot Portal Health Check / HubSpot Audit is designed to:
- Diagnose the architectural issues causing time waste, data problems, and revenue leakage.
- Quantify the impact using your numbers (not generic benchmarks).
- Deliver a prioritized roadmap of architectural fixes with a clear business case.