

Busy Pipelines Don’t Mean Healthy Pipelines
HubSpot makes it easy to see:
- Calls made.
- Emails sent.
- Meetings booked.
Those are volume metrics.
They don’t tell you:
- Were these the right accounts?
- Did conversations progress deals?
- Did they change win rates or cycle time?
We design HubSpot to track activity quality, not just motion.
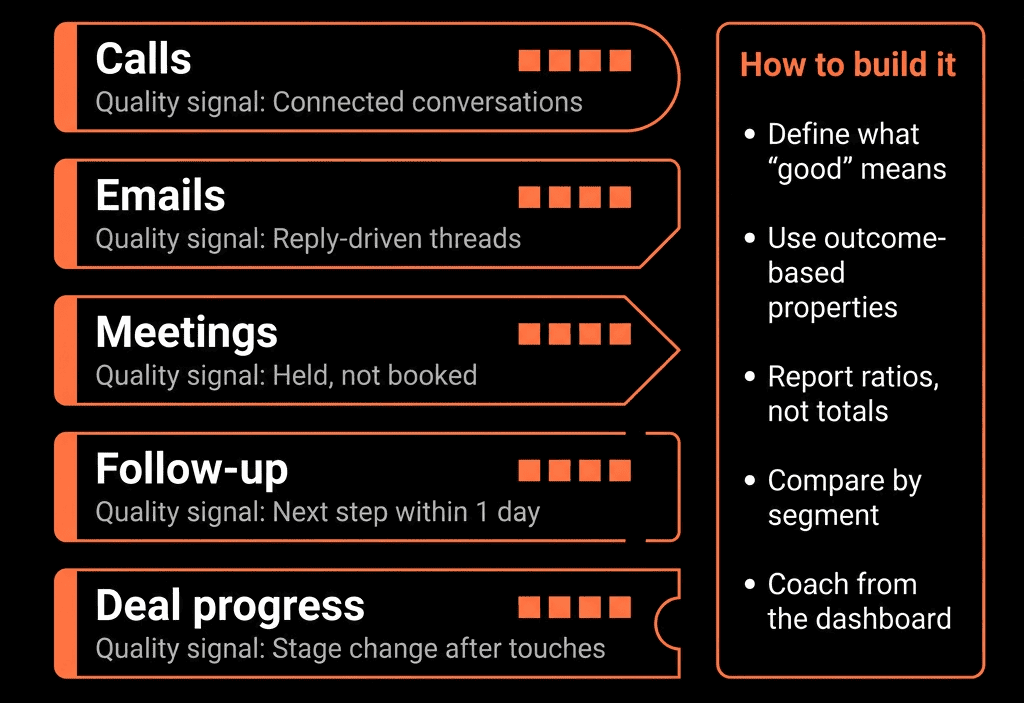
Step 1 – Decide What “Quality” Means for Your Sales Motion
Start with a simple definition of quality per activity type:
Calls
- % that reach a live person.
- % that convert to a meeting.
Emails
- Reply rate (not just opens/clicks).
- Meetings created from replies.
Meetings
- Progression to next stage or creation of an opportunity.
- Completion of key discovery/qualification fields.
Quality is always “did this activity move us closer to revenue?”
Write these definitions down before building reports.
Step 2 – Standardize Activity Logging and Outcomes
You can’t measure quality if everyone logs differently.
In HubSpot:
Calls
- Use call outcomes consistently (Connected, Left voicemail, No-answer, Wrong number, etc.).
- Train reps to set outcomes on every call.
Meetings
- Use Meeting outcome (Completed, No-show, Rescheduled).
- Require association to the right Contact, Company, Deal.
Emails
- Use logged/trackable emails from HubSpot or CRM extensions.
- Distinguish between automated vs 1:1 emails via properties or reporting filters.
Tasks
- Clear task types (Call, Email, To-do).
- Completion logged in HubSpot, not private to-do apps.
This gives you structured inputs for quality metrics.
Step 3 – Add a Few Key Deal & Contact Properties to Capture “Quality Moments”
We then connect activities to progression.
On Deals:
- Next step (Text).
- Next step date (Date).
- Key stakeholder identified (Yes/No).
- Decision maker identified (Yes/No).
- Discovery complete (Yes/No or date).
On Contacts (for early-stage quality):
- Connected call last date.
- First meeting date.
Activities are raw; these properties show impact.
Step 4 – Use Playbooks to Tie Conversations to Structured Data
Activity quality is heavily influenced by conversation quality.
Use HubSpot Playbooks (discovery, demo, proposal):
Each Playbook question mapped to properties like:
- Primary pain.
- Budget status.
- Timeline.
- Number of stakeholders.
This lets you later compare:
- Deals where Playbooks were completed vs not.
- Reps who consistently fill key fields vs those who don’t.
Now quality isn’t just how many meetings—they’re what was learned and recorded.
Step 5 – Build “Quality per Activity” Reports
Now we convert raw data into quality metrics.
5.1 Calls
Create reports:
Calls by rep with outcome breakdown
- % Connected vs Voicemail vs No-answer.
Meetings booked from calls
- Number of meetings where previous interaction was a call from that rep.
- Or: Deals created within X days of connected calls.
Key KPIs:
- Connection rate.
- Meetings per 100 calls.
5.2 Emails
Reports:
- 1:1 emails sent vs replies by rep.
- Meetings created from email replies (filter meeting associations).
Key KPIs:
- Reply rate.
- Meetings per 100 manual emails.
5.3 Meetings
Reports:
- Meetings completed vs no-shows (by rep/segment).
- Deals moving stage within X days after a meeting.
Key KPIs:
- Show rate.
- Stage progression rate post-meeting.
These show which activities actually move deals forward.
Step 6 – Link Activity Quality to Pipeline and Revenue
The most important step: join activities to outcomes.
Build custom reports (by rep / team / segment):
Activity → Pipeline created
Compare:
- Call volume vs Opportunities created.
- Meetings vs Opportunities created.
Activity → Win rate & deal size
- Reps with high connection + discovery completion vs win rate.
- Deals where Discovery complete = Yes vs win rate and sales cycle.
Examples of insights:
- Rep A makes fewer calls but has higher connection and meeting rates → better targeting or messaging.
- Deals with completed discovery Playbooks close faster and at higher values.
This moves manager coaching from “do more” to “do more of what works”.
Step 7 – Add Simple Activity Quality KPIs to Dashboards
Build a Sales Activity Quality dashboard with:
Calls
- Calls per rep + connection rate.
- Meetings booked from calls.
Emails
- 1:1 emails per rep + reply rate.
- Meetings from email replies.
Meetings
- Completed vs no-show rate.
- Deals that progressed stage after a meeting.
Conversation quality proxies
- % of active deals with discovery fields completed.
- % of mid-late stage deals with decision maker identified and next step set.
Use this in weekly sales meetings alongside pure volume metrics.
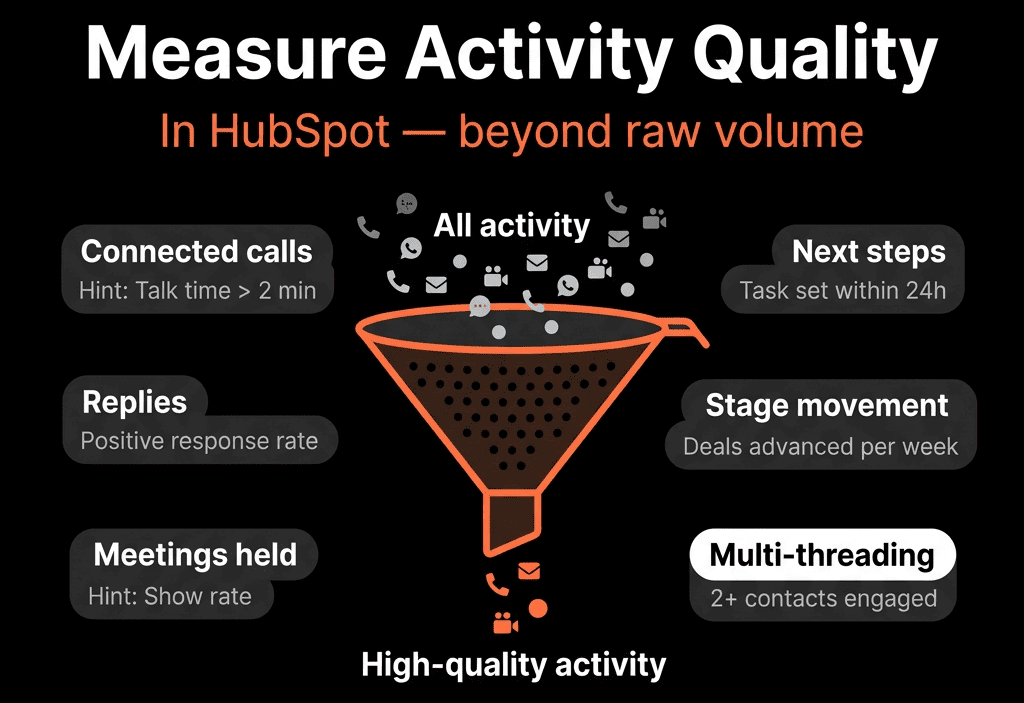
Step 8 – Use Workflows to Enforce Minimum Quality Standards
Automation can nudge reps toward better activity quality.
Examples:
- If Next step date is in the past and deal is in mid/late stage → create task and notify rep.
- If a meeting is completed but no Next step is set → task: “Log next step for [Deal]”.
- If Decision maker identified = No in late-stage deals → alert manager.
This gently forces quality behaviors without heavy policing.
Step 9 – Coach Reps Using Quality Data, Not Just Totals
In 1:1s and team reviews, focus on:
- Connection and reply rates, not just dials and sends.
- Meetings that progress deals, not just meetings booked.
- Completion of discovery/decision fields, not just note length.
Ask:
- “Why do your calls convert more/less to meetings?”
- “What are you doing differently in discovery on opps that close?”
- “Which email templates give you the best reply rates?”
Use the dashboard as a mirror and the Playbook data as context.
Step 10 – Iterate KPIs Based on What Correlates With Wins
Over time, use HubSpot to see which quality metrics truly matter:
- Maybe connection rate isn’t as predictive as “discovery completed by stage X”.
- Maybe meetings booked matter less than “meetings with economic buyer present”.
Refine:
- Properties you collect.
- Playbook questions.
- Dashboard KPIs and coaching focus.
Keep what correlates with better win rates and shorter cycles; drop the rest.
Want Help Turning HubSpot Into a Sales Quality Engine?
If your current HubSpot reporting celebrates “dials and emails” but doesn’t explain who’s actually selling well and why, we can help.
Through our HubSpot Portal Health Check and Managed RevOps Retainer / Migration & ROI Plan, we:
- Audit your current activity logging and reporting setup.
- Design an activity quality framework that fits your sales motion.
- Configure properties, Playbooks, workflows, and dashboards in HubSpot.
- Train managers to coach using quality metrics tied directly to revenue.
- So your team stops chasing vanity activity targets—and starts improving the behaviors that actually close deals.